

Answered step by step
Verified Expert Solution
Question
1 Approved Answer
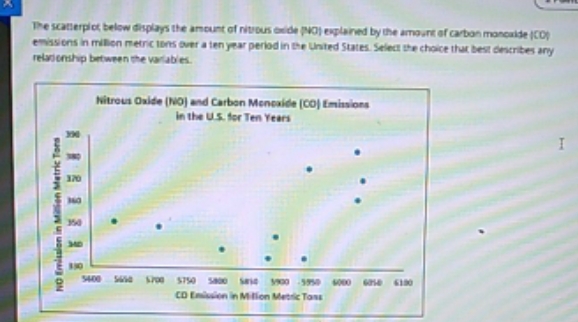
the scattewrplot The scallerplot below display's the amount of nitrous oxide PIO) explained by the amount of carbon mancaide [CD) emissions in millen metric tons
the scattewrplot
Step by Step Solution
There are 3 Steps involved in it
Step: 1

Get Instant Access to Expert-Tailored Solutions
See step-by-step solutions with expert insights and AI powered tools for academic success
Step: 2

Step: 3
Ace Your Homework with AI
Get the answers you need in no time with our AI-driven, step-by-step assistance
Get Started
High School Math 2012 Common-core Algebra 2 Grade 10/11
Authors: Savvas Learning Co
Student Edition
9780133186024, 0133186024