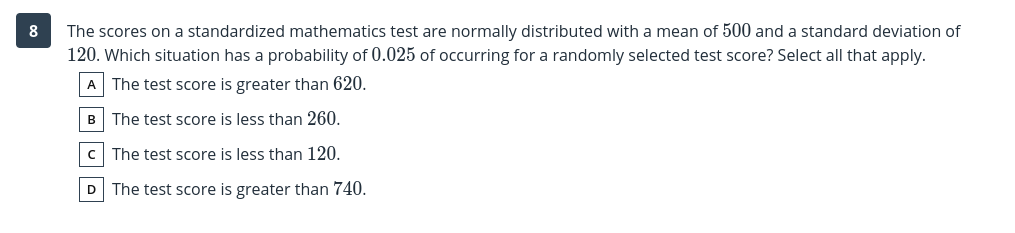
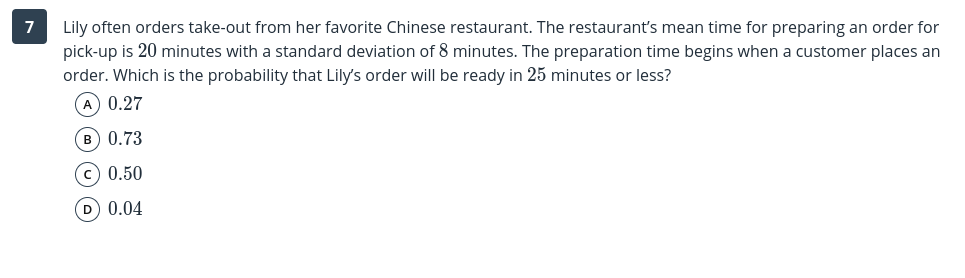
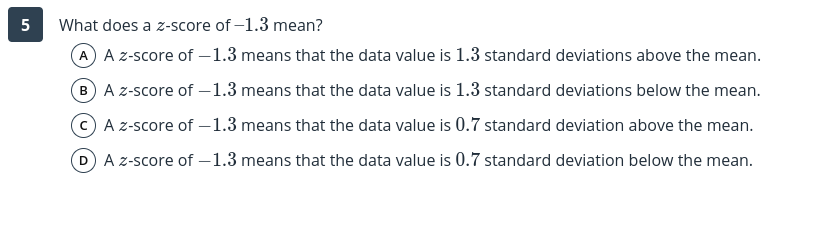
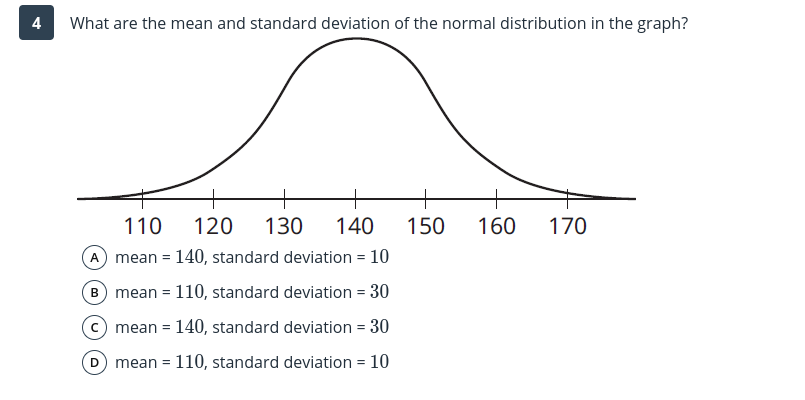
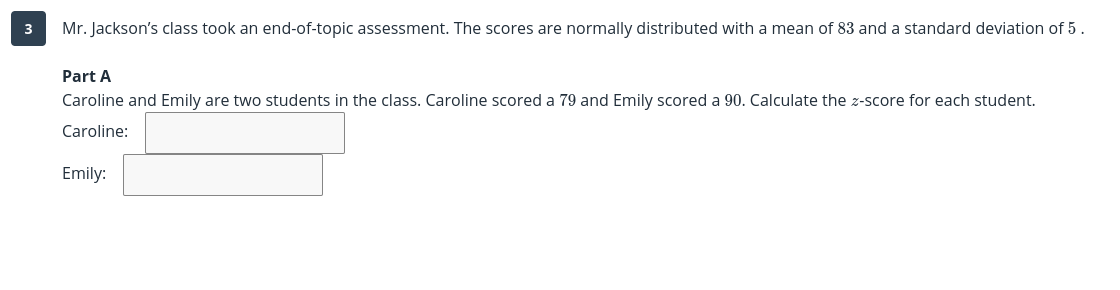
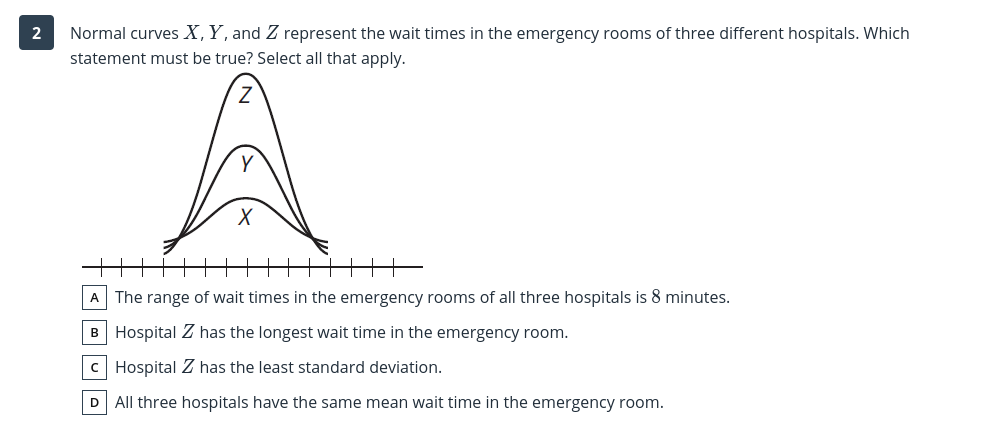
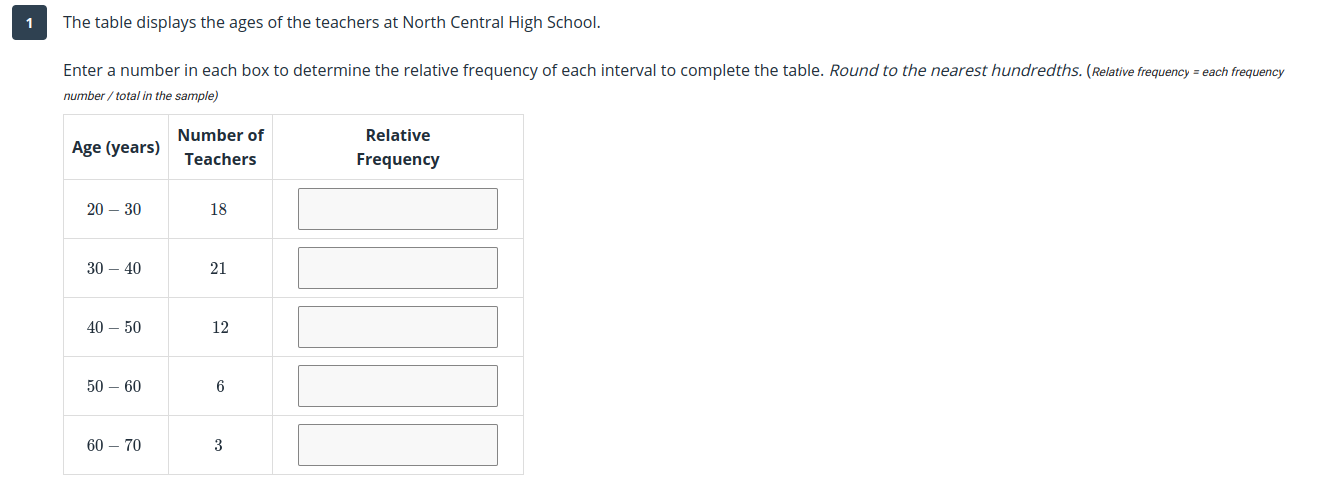
The scores on a standardized mathematics test are normally distributed with a mean of 500 and a standard deviation of 120. Which situation has a probability of 0.025 of occurring for a randomlyr selected test score? Select all that apply. A The test score is greater than 620. The test score is less than 260. B C The test score is less than 120. D The test score is greater than 740. Lily often orders takeout from her favorite Chinese restaurant. The restaurant's mean time for preparing an order for pickup is 20 minutes with a standard deviation ofS minutes. The preparation time begins when a customer places an order. Which is the probability that Lily's order will be ready in 25 minutes or less? \fa 1What does a z-score ot1.3 mean? G) A zscore of 1.3 means that the data value is 1.3 standard deviations above the mean. A zscore of 1.3 means that the data value is 1.3 standard deviations below the mean. 6:) A zscore of 1.3 means that the data value is 0.? standard deviation above the mean. G) A zscore of 1.3 means that the data value is 0.? standard deviation below the mean. n What are the mean and standard deviation of the normal distribution in the graph? __| -_ 110 120 130 140 150 160 170 mean = 140, standard deviation = l mean = 110, standard deviation = 30 6:) mean = 140, standard deviation = 30 mean = 110, standard deviation = 10 3 Mr. Jackson's class took an end-of-topic assessment. The scores are normally distributed with a mean of 83 and a standard deviation of 5 . Part A Caroline and Emily are two students in the class. Caroline scored a 79 and Emily scored a 90. Calculate the z-score for each student. Caroline: Emily:a Normal curves X. Y, and Z represent the wait times in the emergency rooms ofthree different hospitals. Which statement must be true? Select all that apply. X iiiiiiiiiiiiiii A The range of wait times in the emergency rooms of all three hospitals is 8 minutes. B Hospital Z has the longest wait time in the emergency room. c Hospital Z has the least standard deviation. D All three hospitals have the same mean wait time in the emergency room. 1 The table displays the ages of the teachers at North Central High School. Enter a number in each box to determine the relative frequency of each interval to complete the table. Round to the nearest hundredths. ( Relative frequency = each frequency number / total in the sample) Number of Relative Age (years) Teachers Frequency 20 - 30 18 30 - 40 21 40 - 50 12 50 - 60 6 60 - 70 3