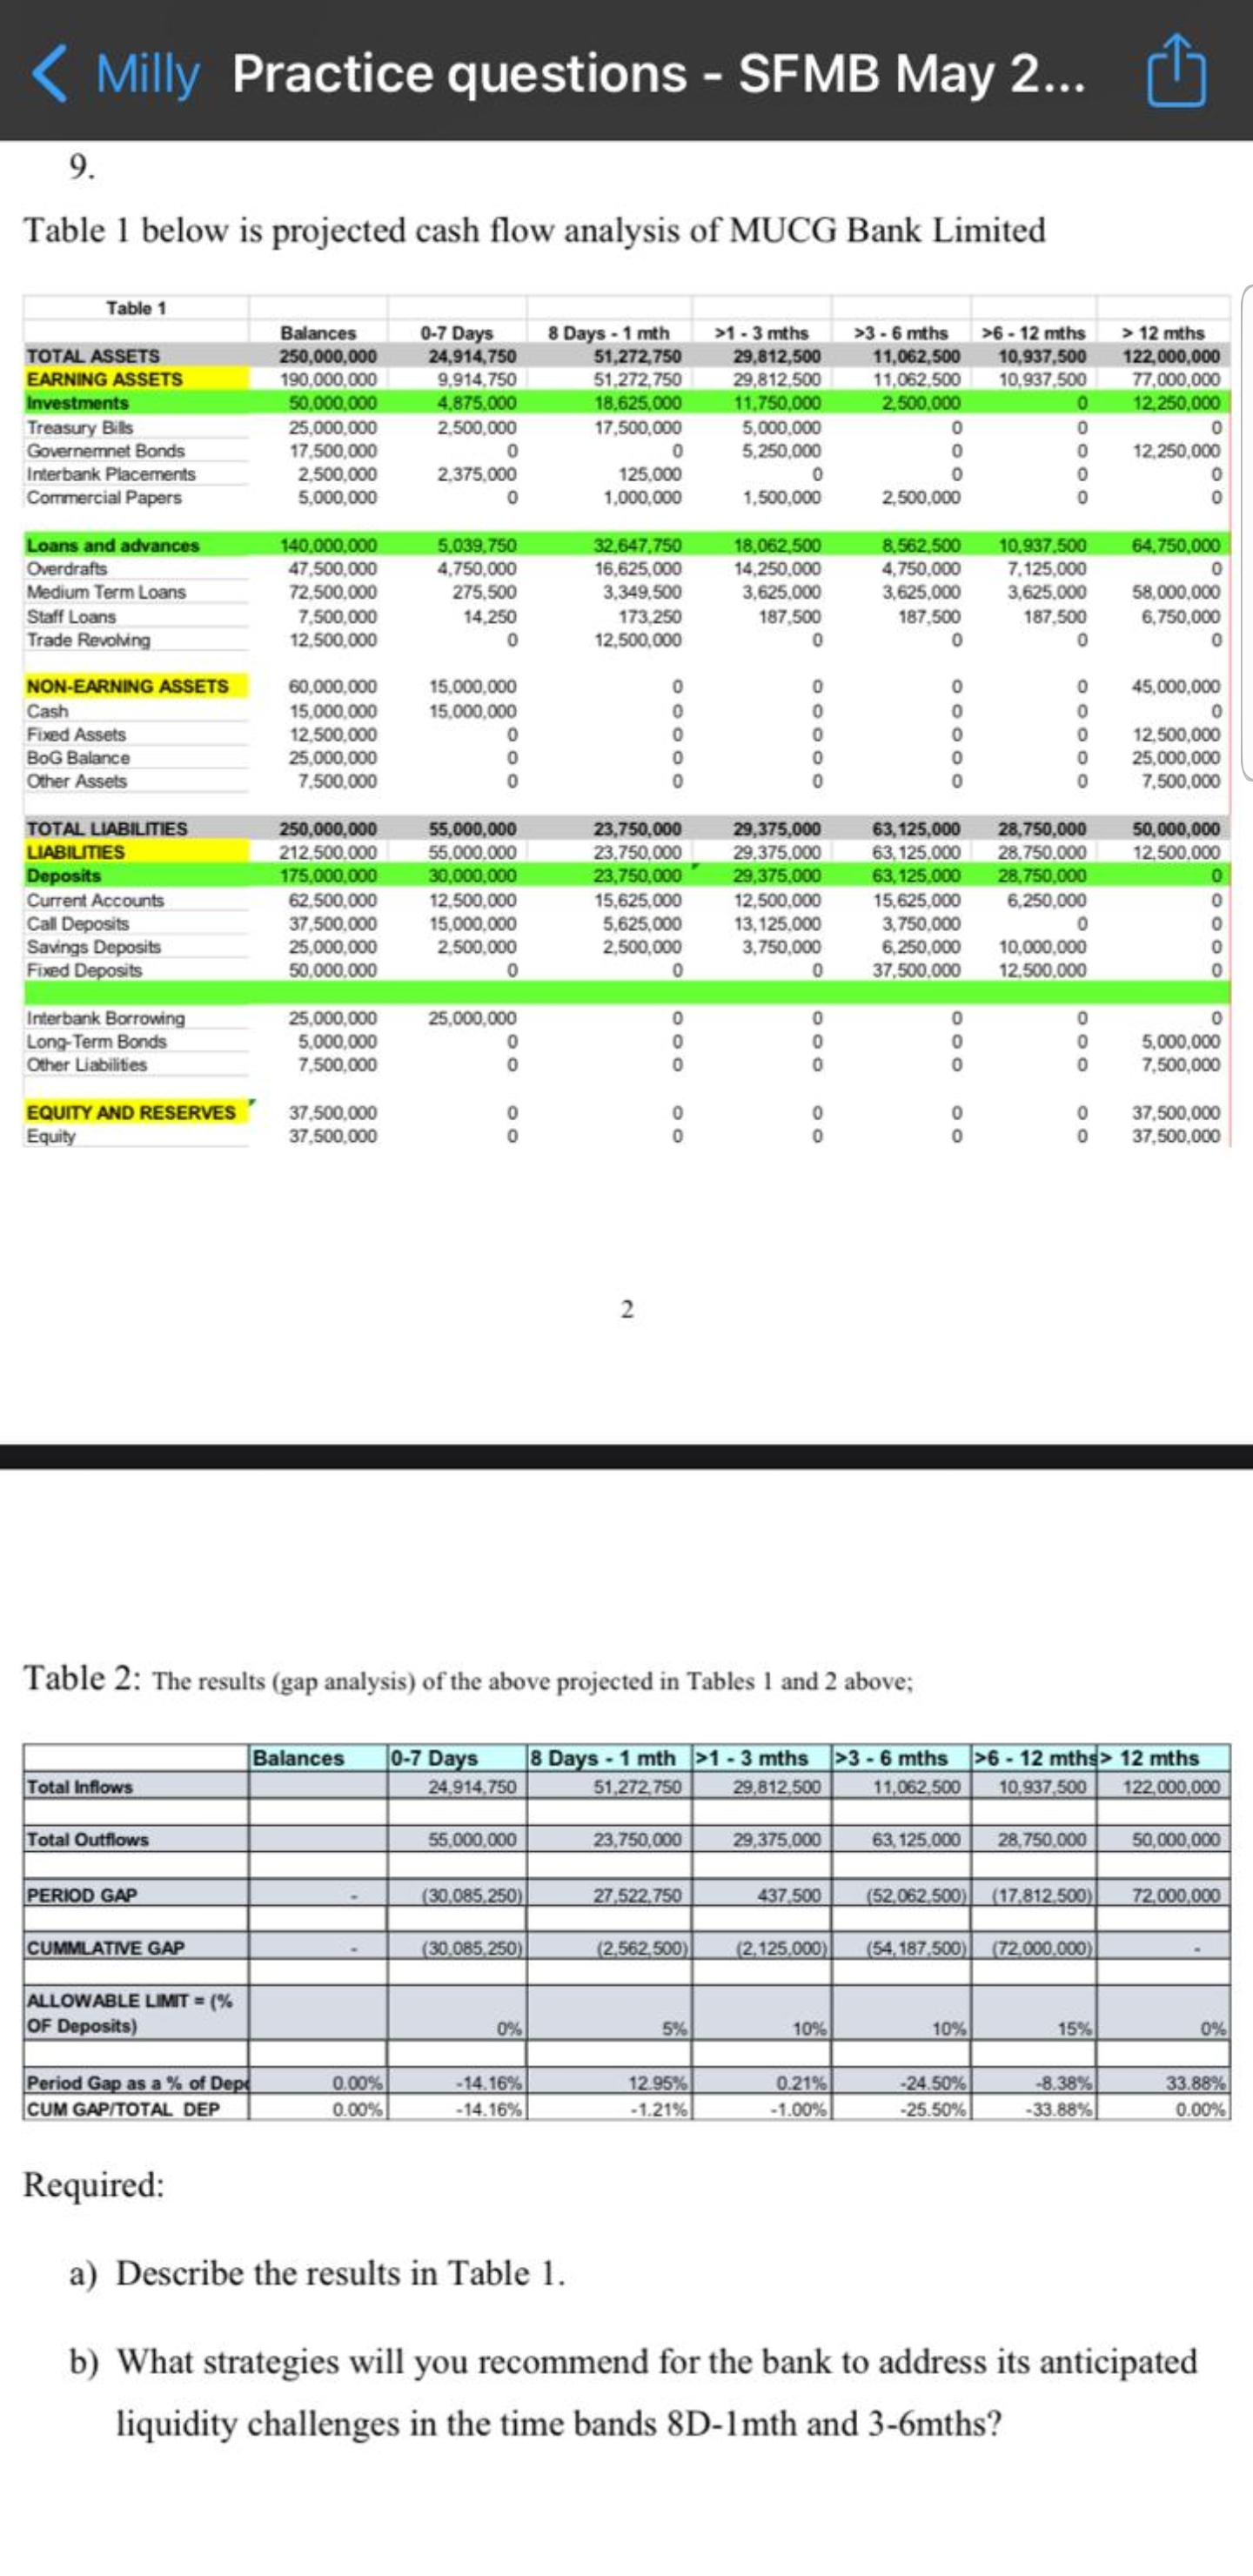
The Screenshot contains the question
1 - 3 mths >3 - 6 mths >6 - 12 mths > 12 mths TOTAL ASSETS 250,000,000 24,914,750 51,272,750 29,812,500 11,062,500 10,937,500 122,000,000 EARNING ASSETS 190,000,000 9,914.750 51,272,750 29,812.500 11,062,500 10,937.500 77,000,000 Investments 50.000,000 4,875,000 18.625,000 11,750,000 2,500.000 0 12,250,000 Treasury Bills 25,000,000 2,500,000 17,500,000 5,000,000 Governemnet Bonds 17.500,000 0 0 5,250,000 12,250,000 Interbank Placements 2,500,000 2,375,000 125,000 Commercial Papers 5,000,000 1,000,000 1,500,000 2,500,000 Loans and advances 140.000.000 5.039.750 32.647.750 18.062.500 8.562.500 10.937.500 64,750,000 Overdrafts 47,500,000 4,750,000 16,625,000 14,250,000 4,750,000 7.125,000 Medium Term Loans 72.500,000 275,500 3,349,500 3,625,000 3,625,000 3,625.000 58,000,000 Staff Loans 7,500,000 14,250 173,250 187,500 187,500 187,500 6,750,000 Trade Revolving 12,500,000 12,500,000 0 0 0 NON-EARNING ASSETS 60,000,000 15,000,000 45,000,000 Cash 15,000,000 15.000,000 Fixed Assets 12,500,000 ooooo 0 12,500,000 BOG Balance 25,000,000 25,000,000 Other Assets 7.500,000 7.500,000 TOTAL LIABILITIES 250,000,000 55,000,000 23,750,000 29,375,000 63,125,000 28,750,000 50,000,000 LIABILITIES 212,500.000 55,000.000 23.750,000 29.375,000 63, 125.000 28.750.000 12,500,000 Deposits 175,000,000 30,000,000 23,750,000 29,375,000 63,125,000 28,750,000 Current Accounts 62,500,000 12,500,000 15,625,000 12,500,000 5,625,000 6,250,000 Call Deposits 37,500,000 15,000,000 5,625,000 13,125,000 3,750,000 Savings Deposits 25,000,000 2,500,000 2,500,000 3,750,000 6,250,000 10,000,000 Fixed Deposits 50,000,000 0 37,500,000 12.500.000 Interbank Borrowing 25,000,000 25,000,000 Long-Term Bonds 5,000,000 5,000,000 Other Liabilities 7,500,000 7,500,000 EQUITY AND RESERVES 37,500,000 OO 37.500,000 oo Equity 37,500,000 37,500,000 N Table 2: The results (gap analysis) of the above projected in Tables I and 2 above; Balances 0-7 Days 8 Days - 1 mth >1 - 3 mths >3 - 6 mths >6 - 12 mths> 12 mths Total Inflows 24,914.750 51,272,750 29,812,500 11,062,500 10,937,500 122,000,000 Total Outflows 55,000.000 23,750,000 29,375,000 63, 125,000 28,750,000 50,000,000 PERIOD GAP (30.085,250) 27.522.750 437.500 (52,062 500) (17.812.500) 72,000,000 CUMMLATIVE GAP (30.085,250) (2.562,500) (2,125.000) (54,187.500) (72000.000) ALLOWABLE LIMIT = (% OF Deposits) 0%% 5% 10% 10% 15% 0% Period Gap as a % of Dep 0.00% -14.16% 12 95% 0.21% 24.50% 8.38% 33.88% CUM GAP/TOTAL DEP 0.00% -14.16% -1.21% -1.00% -25.50% -33.88% 0.00% Required: a) Describe the results in Table 1. b) What strategies will you recommend for the bank to address its anticipated liquidity challenges in the time bands 8D-1mth and 3-6mths


