Question
The shape of a distribution is a rough guide to whether the mean and standard deviation are a helpful summary of center and spread. For
The shape of a distribution is a rough guide to whether the mean and standard deviation are a helpful summary of center and spread. For which of these distributions would x and sbe useful? In each case, give a reason for your decision.
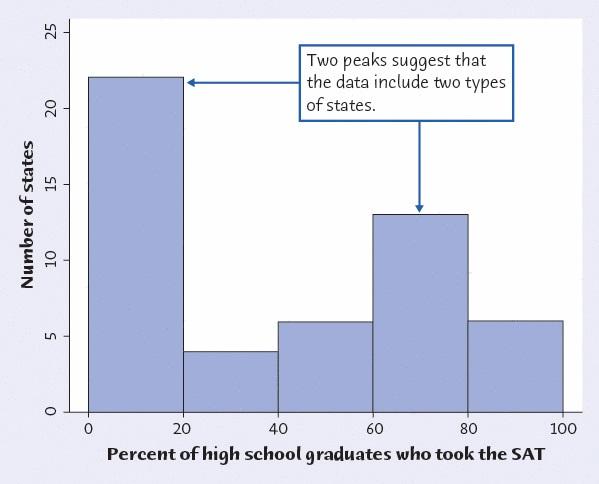
(a) Percent of high school graduates in the states taking the SAT as shown below

a. The distribution is fairly symmetric, and therefore x and s are useful measures.
b. x and s are resistant measures, and therefore are not useful measures for asymmetric distributions.
c. x and s are useful descriptions of the center and spread for any type of distribution.
d. The distribution is not symmetric, and therefore x and s are not useful measures.
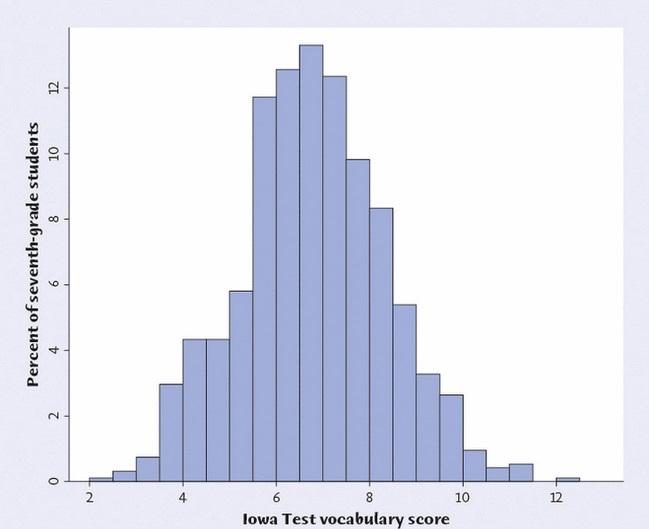
(b) Iowa Test scores as shown below

a. x and s are useful descriptions of the center and spread for any type of distribution.
b. x is useful but s isn't because the distribution is symmetric.
c. The distribution is fairly symmetric and free of outliers, and therefore x and s are useful measures.
d. x and s are resistant measures, and therefore they don't work for symmetric distribution.
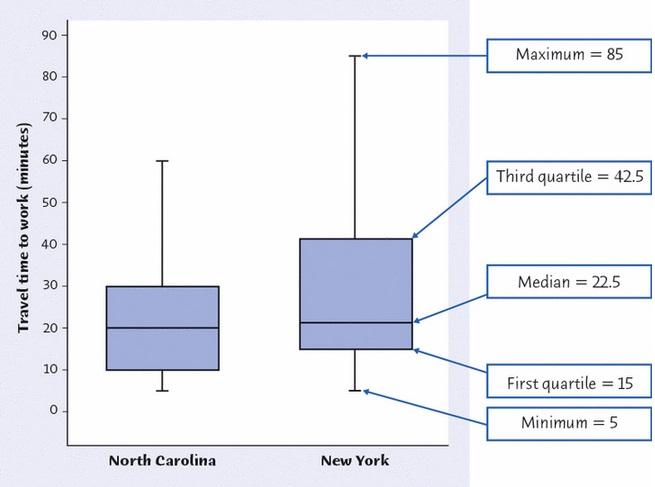
(c) New York travel times as shown below

a. x and s are useful descriptions of the center and spread for any type of distribution.
b. s is useful but x isn't because of the tail on the left.
c. x and s are resistant measures, and therefore they aren't influenced by the skewed distribution.
d. The tail on the right strongly influences both x and s, so they are not very useful.
Two peaks suggest that the data include two types 20 of states. 20 40 60 80 100 Percent of high school graduates who took the SAT Number of states 25 ST
Step by Step Solution
3.40 Rating (163 Votes )
There are 3 Steps involved in it
Step: 1
The shape of a distribution is a rough guide to whether the mean a...
Get Instant Access to Expert-Tailored Solutions
See step-by-step solutions with expert insights and AI powered tools for academic success
Step: 2

Step: 3

Ace Your Homework with AI
Get the answers you need in no time with our AI-driven, step-by-step assistance
Get Started


