Answered step by step
Verified Expert Solution
Question
1 Approved Answer
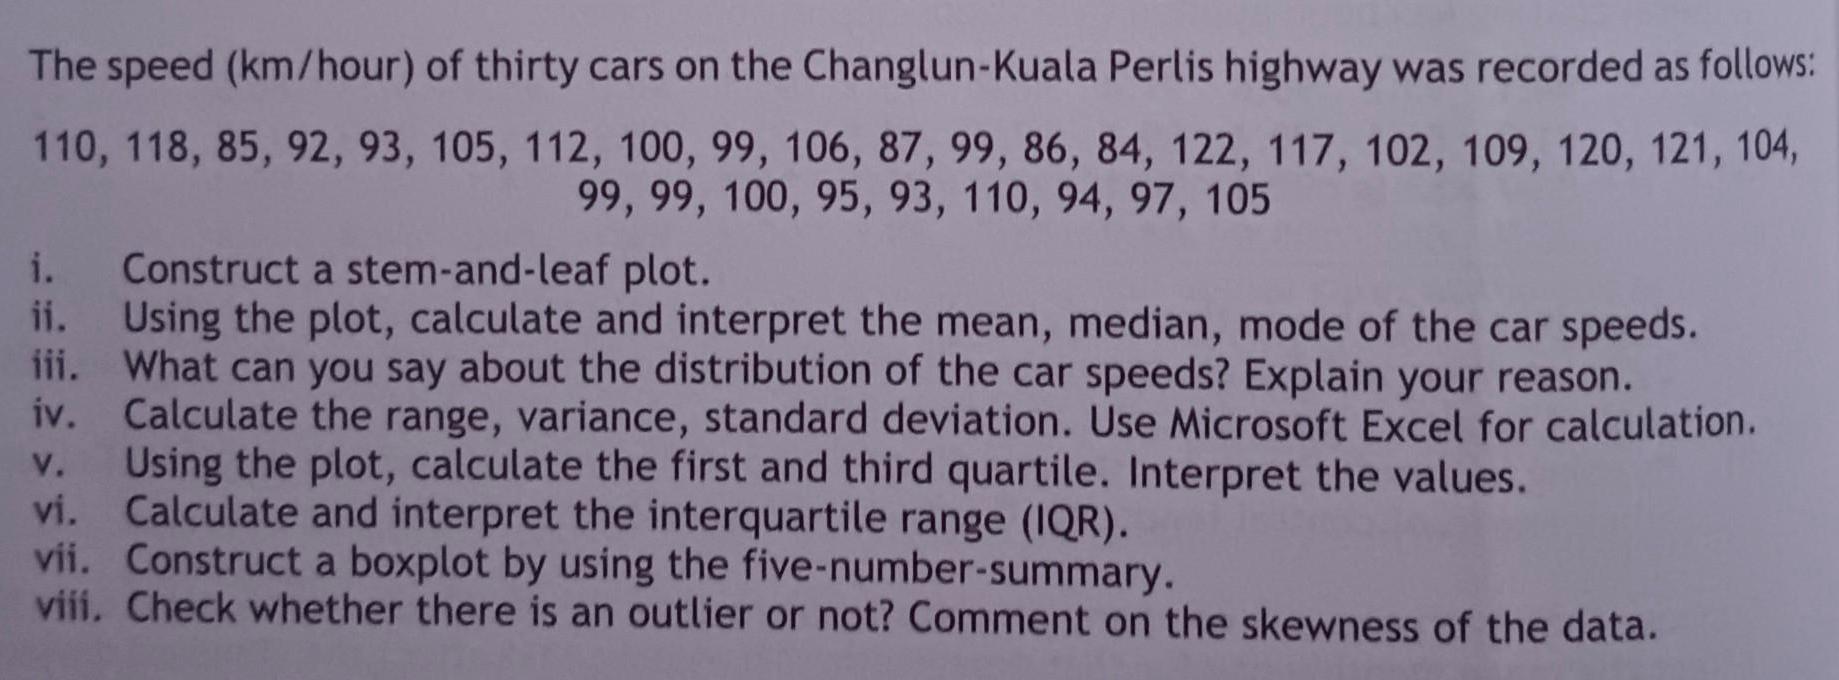
The speed (km/hour) of thirty cars on the Changlun-Kuala Perlis highway was recorded as follows: 110, 118, 85, 92, 93, 105, 112, 100, 99,

The speed (km/hour) of thirty cars on the Changlun-Kuala Perlis highway was recorded as follows: 110, 118, 85, 92, 93, 105, 112, 100, 99, 106, 87, 99, 86, 84, 122, 117, 102, 109, 120, 121, 104, 99, 99, 100, 95, 93, 110, 94, 97, 105 i. Construct a stem-and-leaf plot. ii. Using the plot, calculate and interpret the mean, median, mode of the car speeds. iii. What can you say about the distribution of the car speeds? Explain your reason. iv. V. Calculate the range, variance, standard deviation. Use Microsoft Excel for calculation. Using the plot, calculate the first and third quartile. Interpret the values. vi. Calculate and interpret the interquartile range (IQR). vii. Construct a boxplot by using the five-number-summary. viii. Check whether there is an outlier or not? Comment on the skewness of the data.
Step by Step Solution
★★★★★
3.44 Rating (151 Votes )
There are 3 Steps involved in it
Step: 1
i Construct a stemandleaf plot A stemandleaf plot organizes data by separating each data point into ...
Get Instant Access to Expert-Tailored Solutions
See step-by-step solutions with expert insights and AI powered tools for academic success
Step: 2

Step: 3

Ace Your Homework with AI
Get the answers you need in no time with our AI-driven, step-by-step assistance
Get Started


