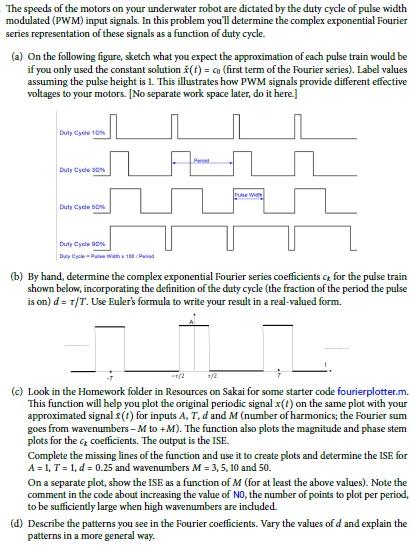
The speeds of the motors on your underwater robot are dictated by the duty cycle of pulse width modulated (PWM) input signals. In this problem you'll determine the complex exponential Fourier series representation of these signals as a function of duty cycle. (a) On the following figure, sketch what you expect the approximation of each pulse train would be if you only used the constant solution i(t) = co (first term of the Fourier series). Label values assuming the pulse height is 1. This illustrates how PWM signals provide different effective voltages to your motors. [No separate work space later, do it here.] Duty Cycle 10 Duty Cycle Pue Wom Duty Cycles Duty Cyde 90 Durchmesed (b) By hand determine the complex exponential Fourier series coefficients at for the pulse train shown below, incorporating the definition of the duty cycle (the fraction of the period the pulse is on) d= 7/T. Use Euler's formula to write your result in a real-valued form. 12 (c) Look in the Homework folder in Resources on Sakai for some starter code fourierplotter.m. "This function will help you plot the original periodic signal x(t) on the same plot with your approximated signal (1) for inputs A, T, d and M (number of harmonics; the Fourier sum goes from wavenumbers-M to +M). The function also plots the magnitude and phase stem plots for the coefficients. The output is the ISE. Complete the missing lines of the function and use it to create plots and determine the ISE for A = 1, T = 1, d = 0.25 and wavenumbers M = 3, 5, 10 and 50. On a separate plot, show the ISE as a function of M (for at least the above values). Note the comment in the code about increasing the value of NO, the number of points to plot per period, to be sufficiently large when high wavenumbers are included. (d) Describe the patterns you see in the Fourier coefficients. Vary the values of d and explain the patterns in a more general way. The speeds of the motors on your underwater robot are dictated by the duty cycle of pulse width modulated (PWM) input signals. In this problem you'll determine the complex exponential Fourier series representation of these signals as a function of duty cycle. (a) On the following figure, sketch what you expect the approximation of each pulse train would be if you only used the constant solution i(t) = co (first term of the Fourier series). Label values assuming the pulse height is 1. This illustrates how PWM signals provide different effective voltages to your motors. [No separate work space later, do it here.] Duty Cycle 10 Duty Cycle Pue Wom Duty Cycles Duty Cyde 90 Durchmesed (b) By hand determine the complex exponential Fourier series coefficients at for the pulse train shown below, incorporating the definition of the duty cycle (the fraction of the period the pulse is on) d= 7/T. Use Euler's formula to write your result in a real-valued form. 12 (c) Look in the Homework folder in Resources on Sakai for some starter code fourierplotter.m. "This function will help you plot the original periodic signal x(t) on the same plot with your approximated signal (1) for inputs A, T, d and M (number of harmonics; the Fourier sum goes from wavenumbers-M to +M). The function also plots the magnitude and phase stem plots for the coefficients. The output is the ISE. Complete the missing lines of the function and use it to create plots and determine the ISE for A = 1, T = 1, d = 0.25 and wavenumbers M = 3, 5, 10 and 50. On a separate plot, show the ISE as a function of M (for at least the above values). Note the comment in the code about increasing the value of NO, the number of points to plot per period, to be sufficiently large when high wavenumbers are included. (d) Describe the patterns you see in the Fourier coefficients. Vary the values of d and explain the patterns in a more general way