The spreadsheet can be found on moodle entitled ExcelAssignmentTFB. The spreadsheet details information relating to orders for products of a company.
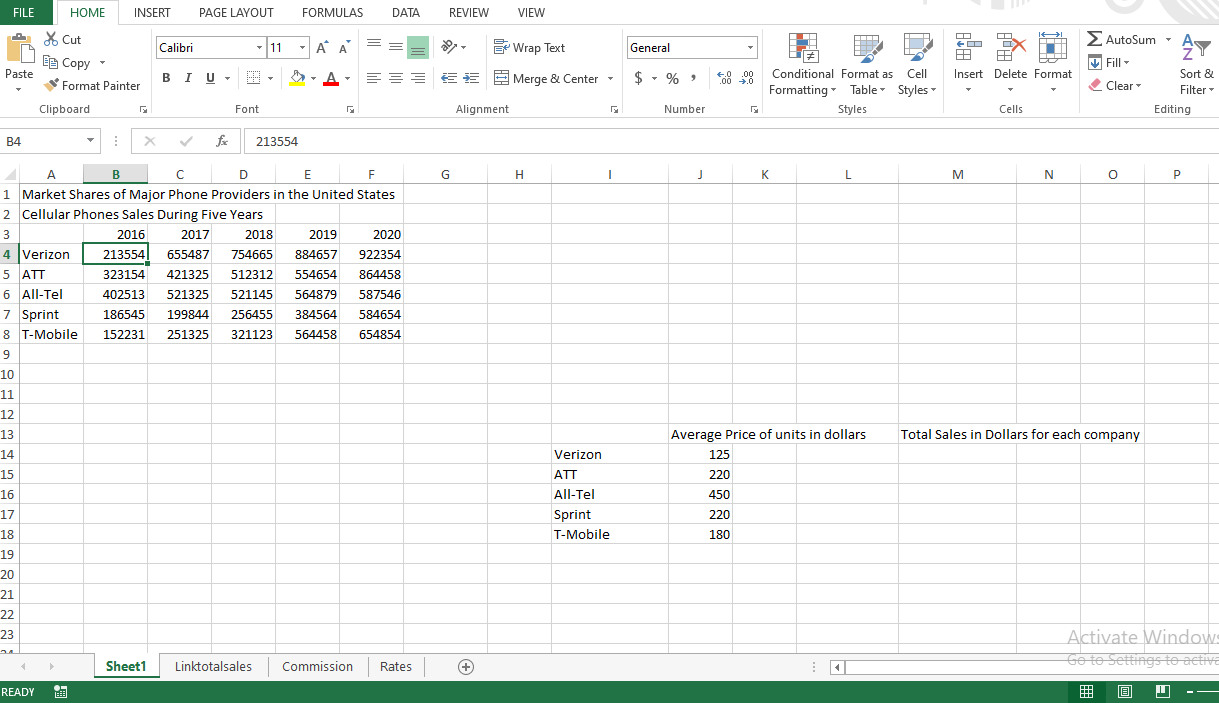
- Open the spreadsheet ExcelAssignmentTFB on the first worksheet. The spreadsheet should be formatted in a user friendly manner so that it is easy to read and analyse the existing data. For example, in the first worksheet is it easy to read all the data/headings? What could you do to improve it? What is missing for it to be more user friendly? We want to make the spreadsheet look professional and attractive to analyse.
- For this data we need to be able to see the total, average, min, max and count of the sales for both phone units and for each year .Illustrate these calculations on the spreadsheet ensuring that the values are presented professionally. This must be done using formulae. We also need to find the total sales in dollars for each company.
- For each company, we need to classify as to whether they are good or poor sales. Therefore we need to add a new column and use a formula to automatically decide for each company which of the two categories each order fits into based on the following information:
Total order greater than or equal to 2,500,000 is Target sales achieved
Total order up to 2,500,000 equals Poor sales
Again presentation of this is important
4. The spreadsheet has four worksheets. In the second worksheet entitled LinkstotalSales create a linked formula which shows the total of the sales for all the products. This is just one cell on one spreadsheet
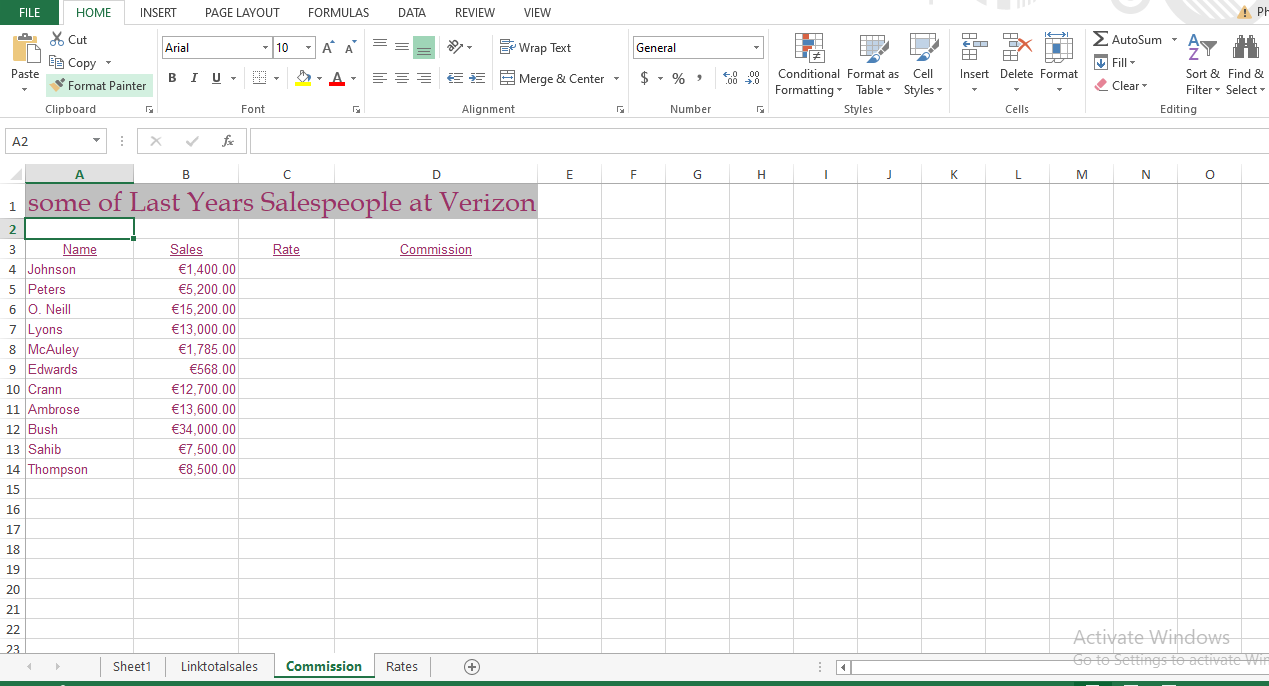
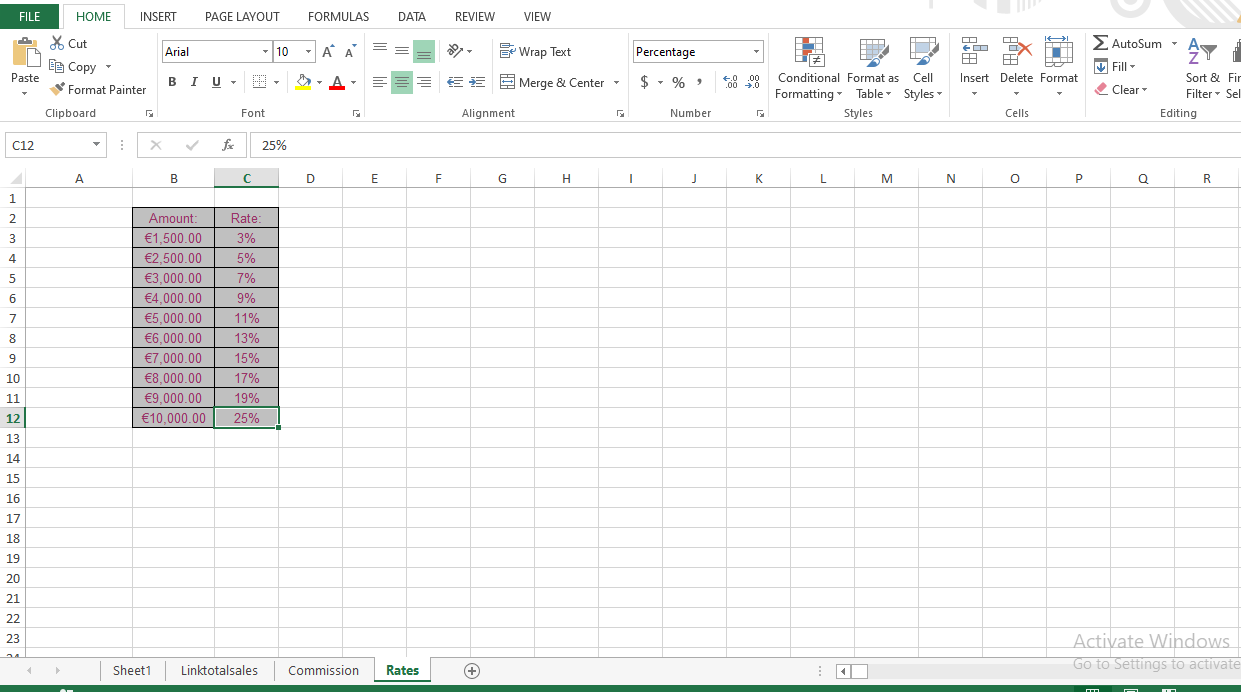
5. Verizon is calculating sales bonuses based on last years sales in the worksheet entitled Commission for its sales reps. Working with the other worksheet entitled rates devise a function which will work out the commission for each rep. Also, sort the names in the Commission worksheet in descending order as this was requested.
6. Create a suitable chart to show each companys total sales in dollars from the first worksheet.Make the chart as user friendly as possible showing enough information to make it clear to everyone. In other words, design it well. Place this chart in a new worksheet and name the worksheet to reflect what the values are representing. Ensure all worksheets named to suit information.
7. Set it up to print effectively.
FILE HOME INSERT PAGE LAYOUT FORMULAS DATA REVIEW VIEW > Calibri 11 - A M Wrap Text General AY Cut e Copy Format Painter Clipboard PA E Insert Delete Format Paste BI U -A- $ % +.000 Merge & Center - Conditional Format as Cell Formatting Table Styles Styles AutoSum- Z Fill- Sort & Clear Filter Editing Font Alignment Number Cells B4 X fr 213554 G H I J K L M N N O P A B B E F 1 Market Shares of Major Phone Providers in the United States 2 Cellular Phones Sales During Five Years 3 2016 2017 2018 2019 2020 4 Verizon 213554 655487 754665 884657 922354 5 ATT 323154 421325 512312 554654 864458 6 All-Tel 402513 521325 521145 564879 587546 7 Sprint 186545 199844 256455 384564 584654 8 T-Mobile 152231 251325 321123 564458 654854 9 10 11 12 13 Total Sales in Dollars for each company Average Price of units in dollars 125 14 220 15 16 Verizon ATT All-Tel Sprint T-Mobile 450 17 220 180 18 19 20 21 22 23 Activate Window Go to Settings to activa Sheet1 Linktotalsales Commission Rates + READY 3 1 FILE HOME INSERT PAGE LAYOUT FORMULAS DATA REVIEW VIEW ! Pham Hue A> Calibri = -11 - A A Wrap Text General FA WE Y Paste % Cut 9 Copy Format Painter Clipboard BIU , . - A Merge & Center $ %) % 4.0 .00 .00 0 Insert Delete Format Conditional Format as Cell Formatting Table Styles Styles AutoSum , Fill - Sort & Find & Clear Filter Select Editing 5 Font Alignment Number Cells A7 X fr B D E - F G H 1 J K L M N o P Q R S T 1 2 3 3 4 5 6 7 8 9 10 11 12 13 14 15 16 17 18 19 20 21 22 23 Activate Windows Go to Settings to activate Windows Sheet1 Linktotalsales Commission Rates READY 1 + FILE HOME INSERT PAGE LAYOUT FORMULAS DATA REVIEW VIEW PH If ED Arial 10 - RM Wrap Text General OX HH % Cut LE Copy Format Painter AY Paste BIU- A T === Insert Delete Format EE T E & - Merge & Center 4.0 .00 .00 0 $ - % AutoSum - Fill - Sort & Find & Clear Filter - Select - Editing Conditional Format as Cell Formatting Table Styles Styles Clipboard Font Alignment Number Cells A2 X foc B D E F G H 1 K K L M N 0 1 some of Last Years Salespeople at Verizon Rate Commission 2 3 Name 4 Johnson 5 Peters 60. Neill 7 Lyons 8 McAuley 9 Edwards 10 Crann 11 Ambrose 12 Bush 13 Sahib 14 Thompson 15 Sales 1,400.00 5,200.00 15,200.00 13,000.00 1,785.00 568.00 12,700.00 13,600.00 34,000.00 7,500.00 8,500.00 16 17 18 19 20 21 22 23 Activate Windows Go to Settings to activate Wir Sheet1 Linktotalsales Commission Rates + FILE HOME INSERT PAGE LAYOUT FORMULAS DATA REVIEW VIEW AutoSum Arial -10 AR A Be Wrap Text Percentage Ay I H H * Cut e Copy E Format Painter Paste BIU Merge & Center $ %, 4.0 .00 .00 0 Insert Delete Format Conditional Format as Cell Formatting Table Styles Styles Fill - Clear Sort & Fir Filter. Sel Editing Clipboard Font Alignment Number Cells C12 fox 25% A B D E F G H 1 J K L M N 0 Q R 1 2 3 4 5 6 7 Amount: 1,500.00 2,500.00 3,000.00 4,000.00 5,000.00 6,000.00 7,000.00 8,000.00 9,000.00 10,000.00 Rate: 3% 5% 7% 9% 11% 13% 15% 17% 19% 25% 8 9 10 11 12 13 14 15 16 17 18 19 20 21 22 23 Activate Windows Go to Settings to activate Sheet1 Linktotalsales Commission Rates MIT n FILE HOME INSERT PAGE LAYOUT FORMULAS DATA REVIEW VIEW > Calibri 11 - A M Wrap Text General AY Cut e Copy Format Painter Clipboard PA E Insert Delete Format Paste BI U -A- $ % +.000 Merge & Center - Conditional Format as Cell Formatting Table Styles Styles AutoSum- Z Fill- Sort & Clear Filter Editing Font Alignment Number Cells B4 X fr 213554 G H I J K L M N N O P A B B E F 1 Market Shares of Major Phone Providers in the United States 2 Cellular Phones Sales During Five Years 3 2016 2017 2018 2019 2020 4 Verizon 213554 655487 754665 884657 922354 5 ATT 323154 421325 512312 554654 864458 6 All-Tel 402513 521325 521145 564879 587546 7 Sprint 186545 199844 256455 384564 584654 8 T-Mobile 152231 251325 321123 564458 654854 9 10 11 12 13 Total Sales in Dollars for each company Average Price of units in dollars 125 14 220 15 16 Verizon ATT All-Tel Sprint T-Mobile 450 17 220 180 18 19 20 21 22 23 Activate Window Go to Settings to activa Sheet1 Linktotalsales Commission Rates + READY 3 1 FILE HOME INSERT PAGE LAYOUT FORMULAS DATA REVIEW VIEW ! Pham Hue A> Calibri = -11 - A A Wrap Text General FA WE Y Paste % Cut 9 Copy Format Painter Clipboard BIU , . - A Merge & Center $ %) % 4.0 .00 .00 0 Insert Delete Format Conditional Format as Cell Formatting Table Styles Styles AutoSum , Fill - Sort & Find & Clear Filter Select Editing 5 Font Alignment Number Cells A7 X fr B D E - F G H 1 J K L M N o P Q R S T 1 2 3 3 4 5 6 7 8 9 10 11 12 13 14 15 16 17 18 19 20 21 22 23 Activate Windows Go to Settings to activate Windows Sheet1 Linktotalsales Commission Rates READY 1 + FILE HOME INSERT PAGE LAYOUT FORMULAS DATA REVIEW VIEW PH If ED Arial 10 - RM Wrap Text General OX HH % Cut LE Copy Format Painter AY Paste BIU- A T === Insert Delete Format EE T E & - Merge & Center 4.0 .00 .00 0 $ - % AutoSum - Fill - Sort & Find & Clear Filter - Select - Editing Conditional Format as Cell Formatting Table Styles Styles Clipboard Font Alignment Number Cells A2 X foc B D E F G H 1 K K L M N 0 1 some of Last Years Salespeople at Verizon Rate Commission 2 3 Name 4 Johnson 5 Peters 60. Neill 7 Lyons 8 McAuley 9 Edwards 10 Crann 11 Ambrose 12 Bush 13 Sahib 14 Thompson 15 Sales 1,400.00 5,200.00 15,200.00 13,000.00 1,785.00 568.00 12,700.00 13,600.00 34,000.00 7,500.00 8,500.00 16 17 18 19 20 21 22 23 Activate Windows Go to Settings to activate Wir Sheet1 Linktotalsales Commission Rates + FILE HOME INSERT PAGE LAYOUT FORMULAS DATA REVIEW VIEW AutoSum Arial -10 AR A Be Wrap Text Percentage Ay I H H * Cut e Copy E Format Painter Paste BIU Merge & Center $ %, 4.0 .00 .00 0 Insert Delete Format Conditional Format as Cell Formatting Table Styles Styles Fill - Clear Sort & Fir Filter. Sel Editing Clipboard Font Alignment Number Cells C12 fox 25% A B D E F G H 1 J K L M N 0 Q R 1 2 3 4 5 6 7 Amount: 1,500.00 2,500.00 3,000.00 4,000.00 5,000.00 6,000.00 7,000.00 8,000.00 9,000.00 10,000.00 Rate: 3% 5% 7% 9% 11% 13% 15% 17% 19% 25% 8 9 10 11 12 13 14 15 16 17 18 19 20 21 22 23 Activate Windows Go to Settings to activate Sheet1 Linktotalsales Commission Rates MIT n