

Question
The spreadsheet entitled performance modeling homework assignment.xlsx contains monthly return data for the period 1995-2013 one hedge fund, Fund #61, called SC Fundamental Value LP.
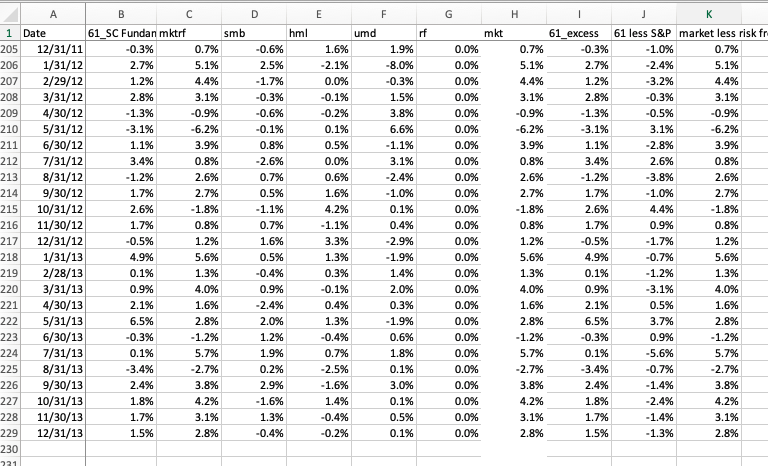
The spreadsheet entitled performance modeling homework assignment.xlsx contains monthly return data for the period 1995-2013 one hedge fund, Fund #61, called SC Fundamental Value LP. It is a long-short equity fund.
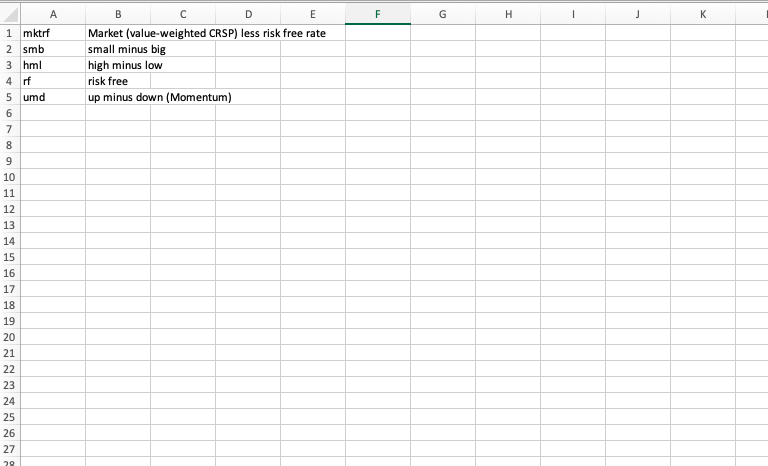
The spreadsheet also contains monthly return data for the risk free rate and the stock market (which is a value-weighted index of all NYSE, NASDAQ, and AMEX stocks and is called mkt), as well as a number of other index returns. The descriptions of the index returns are in the tab called Descriptions.
Univariate measures
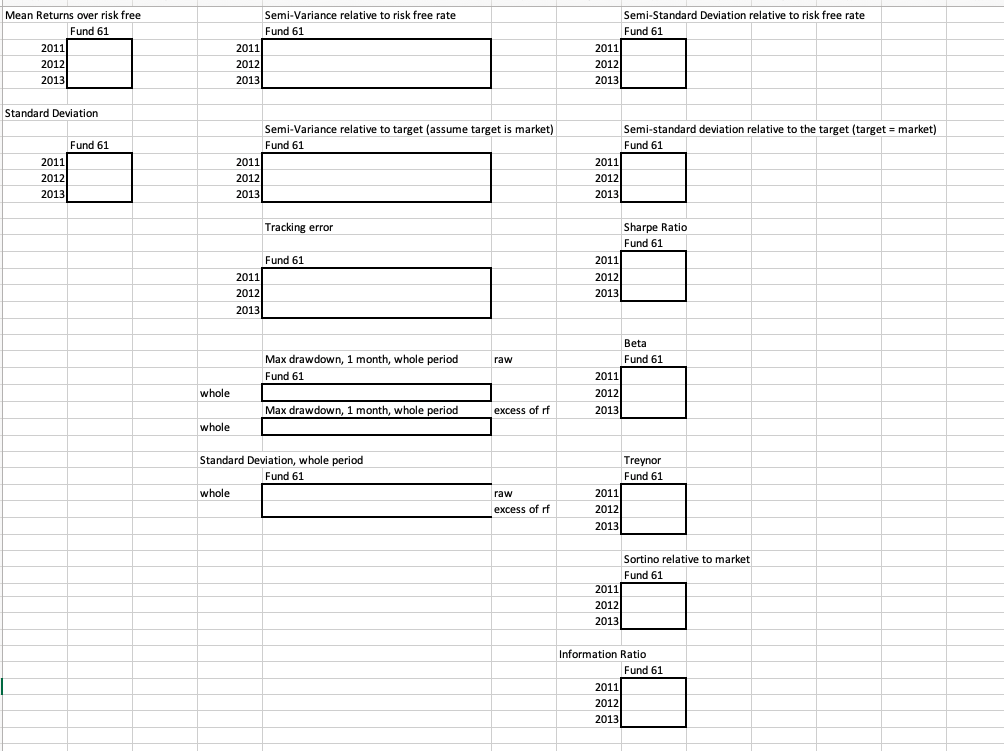
The tab entitled performance measures has a space for you to calculate all the performance measures we have covered. Please calculate these measures as follows for the fund. See spreadsheet
- Average return in excess of risk free rate.
- Standard deviation (function in Excel: stdev.s)
- Semi-Variance (function in excel for variance is VAR. Note that semi-variance is the variance of all negative returns in the year)
- Semi-standard deviation (standard deviation of semi-variance)
- Tracking error (Figure this out using the formulas in the slides and the Excel functions)
- Sharpe ratio
- Beta (using formula)
- Treynor
- Sortino
- Information ratio
For the entire period:
- Maximum monthly drawdown for the entire period
- Standard deviation, whole period (function in Excel: stdev.s)
Multivariate measures
1. Regressions to complete for the fund.
The first regression is a single-factor model, where the factor is the market risk free rate (mktrf).
The second regression is the Fama-French three factor model, where the factors are mktrf, smb, and hml.
The third regression is the Carhart four factor model, where the factors are the three factors from Fama-French plus momentum: umd.
2. Write out the regression equations for all four regressions.
Single factor:
3 factor:
4 factor
3a. What is the R-squared for each equation?
3b.How do you interpret the R-squared? Be specific to your R-squared in interpreting its value.
3c. Also, refer to the individual factors that appear to be contributing to the level of the R-squared, whether these factors are individually statistically significant, and what the coefficients on these factors indicate in terms of the managers style.
Single factor:
3 factor:
4 factor:
4. What is the alpha for each equation? Do these alphas indicate that the manager has skill? *use a p-value of 0.10 for this determination. Also be sure to consider the R-squared value when making this assessment.
Single factor:
3 factor:
4 factor:
5. The fund is a long-short equity fund. Is the coefficient on the market factor consistent with this fund calling itself a long-short equity fund?
Single factor:
3 factor:
4 factor:
\begin{tabular}{|c|c|c|c|c|c|c|c|c|c|c|} \hline A & B & C & D & E & F & G & H & 1 & J & K \\ \hline 1 Date & 61_SC Fundan & & smb & hml & umd & if & mkt & 61_excess & 61 less S\&P & market less risk fr \\ \hline 12/31/11 & 0.3% & 0.7% & 0.6% & 1.6% & 1.9% & 0.0% & 0.7% & 0.3% & 1.0% & 0.7% \\ \hline 1/31/12 & 2.7% & 5.1% & 2.5% & 2.1% & 8.0% & 0.0% & 5.1% & 2.7% & 2.4% & 5.1% \\ \hline 2/29/12 & 1.2% & 4.4% & 1.7% & 0.0% & 0.3% & 0.0% & 4.4% & 1.2% & 3.2% & 4.4% \\ \hline 3/31/12 & 2.8% & 3.1% & 0.3% & 0.1% & 1.5% & 0.0% & 3.1% & 2.8% & 0.3% & 3.1% \\ \hline 4/30/12 & 1.3% & 0.9% & 0.6% & 0.2% & 3.8% & 0.0% & 0.9% & 1.3% & 0.5% & 0.9% \\ \hline 5/31/12 & 3.1% & 6.2% & 0.1% & 0.1% & 6.6% & 0.0% & 6.2% & 3.1% & 3.1% & 6.2% \\ \hline 6/30/12 & 1.1% & 3.9% & 0.8% & 0.5% & 1.1% & 0.0% & 3.9% & 1.1% & 2.8% & 3.9% \\ \hline 7/31/12 & 3.4% & 0.8% & 2.6% & 0.0% & 3.1% & 0.0% & 0.8% & 3.4% & 2.6% & 0.8% \\ \hline 8/31/12 & 1.2% & 2.6% & 0.7% & 0.6% & 2.4% & 0.0% & 2.6% & 1.2% & 3.8% & 2.6% \\ \hline 9/30/12 & 1.7% & 2.7% & 0.5% & 1.6% & 1.0% & 0.0% & 2.7% & 1.7% & 1.0% & 2.7% \\ \hline 10/31/12 & 2.6% & 1.8% & 1.1% & 4.2% & 0.1% & 0.0% & 1.8% & 2.6% & 4.4% & 1.8% \\ \hline 11/30/12 & 1.7% & 0.8% & 0.7% & 1.1% & 0.4% & 0.0% & 0.8% & 1.7% & 0.9% & 0.8% \\ \hline 12/31/12 & 0.5% & 1.2% & 1.6% & 3.3% & 2.9% & 0.0% & 1.2% & 0.5% & 1.7% & 1.2% \\ \hline 1/31/13 & 4.9% & 5.6% & 0.5% & 1.3% & 1.9% & 0.0% & 5.6% & 4.9% & =0.7% & 5.6% \\ \hline 2/28/13 & 0.1% & 1.3% & 0.4% & 0.3% & 1.4% & 0.0% & 1.3% & 0.1% & 1.2% & 1.3% \\ \hline 3/31/13 & 0.9% & 4.0% & 0.9% & =0.1% & 2.0% & 0.0% & 4.0% & 0.9% & 3.1% & 4.0% \\ \hline 4/30/13 & 2.1% & 1.6% & 2.4% & 0.4% & 0.3% & 0.0% & 1.6% & 2.1% & 0.5% & 1.6% \\ \hline 5/31/13 & 6.5% & 2.8% & 2.0% & 1.3% & 1.9% & 0.0% & 2.8% & 6.5% & 3.7% & 2.8% \\ \hline 6/30/13 & 0.3% & 1.2% & 1.2% & 0.4% & 0.6% & 0.0% & 1.2% & 0.3% & 0.9% & 1.2% \\ \hline 7/31/13 & 0.1% & 5.7% & 1.9% & 0.7% & 1.8% & 0.0% & 5.7% & 0.1% & 5.6% & 5.7% \\ \hline 8/31/13 & 3.4% & 2.7% & 0.2% & 2.5% & 0.1% & 0.0% & 2.7% & 3.4% & 0.7% & 2.7% \\ \hline 9/30/13 & 2.4% & 3.8% & 2.9% & 1.6% & 3.0% & 0.0% & 3.8% & 2.4% & 1.4% & 3.8% \\ \hline 10/31/13 & 1.8% & 4.2% & 1.6% & 1.4% & 0.1% & 0.0% & 4.2% & 1.8% & 2.4% & 4.2% \\ \hline 11/30/13 & 1.7% & 3.1% & 1.3% & 0.4% & 0.5% & 0.0% & 3.1% & 1.7% & 1.4% & 3.1% \\ \hline 12/31/13 & 1.5% & 2.8% & 0.4% & 0.2% & 0.1% & 0.0% & 2.8% & 1.5% & 1.3% & 2.8% \\ \hline & & & & & & & & & & \\ \hline \end{tabular} \begin{tabular}{|c|c|c|c|c|c|c|c|c|c|c|c|} \hline & A & B & C & D & E & F & G & H & 1 & J & K \\ \hline 1 & mktrf & \multicolumn{4}{|c|}{ Market (value-weighted CRSP) less risk free rate } & & & & & & \\ \hline 2 & smb & \multicolumn{2}{|c|}{ small minus big } & & & & & & & & \\ \hline 3 & hml & \multicolumn{2}{|c|}{ high minus low } & & & & & & & & \\ \hline 4 & rf & risk free & & & & & & & & & \\ \hline 5 & umd & \multicolumn{3}{|c|}{ up minus down (Momentum) } & & & & & & & \\ \hline \multicolumn{12}{|l|}{6} \\ \hline \multicolumn{12}{|l|}{7} \\ \hline \multicolumn{12}{|l|}{8} \\ \hline \multicolumn{12}{|l|}{9} \\ \hline \multicolumn{12}{|l|}{10} \\ \hline \multicolumn{12}{|l|}{11} \\ \hline \multicolumn{12}{|l|}{12} \\ \hline \multicolumn{12}{|l|}{13} \\ \hline \multicolumn{12}{|l|}{14} \\ \hline \multicolumn{12}{|l|}{15} \\ \hline \multicolumn{12}{|l|}{16} \\ \hline \multicolumn{12}{|l|}{17} \\ \hline \multicolumn{12}{|l|}{18} \\ \hline \multicolumn{12}{|l|}{19} \\ \hline \multicolumn{12}{|l|}{20} \\ \hline \multicolumn{12}{|l|}{21} \\ \hline \multicolumn{12}{|l|}{22} \\ \hline \multicolumn{12}{|l|}{23} \\ \hline \multicolumn{12}{|l|}{24} \\ \hline \multicolumn{12}{|l|}{25} \\ \hline \multicolumn{12}{|l|}{26} \\ \hline 27 & & & & & & & & & & & \\ \hline \end{tabular} \begin{tabular}{|c|c|c|c|c|c|c|c|c|c|c|} \hline A & B & C & D & E & F & G & H & 1 & J & K \\ \hline 1 Date & 61_SC Fundan & & smb & hml & umd & if & mkt & 61_excess & 61 less S\&P & market less risk fr \\ \hline 12/31/11 & 0.3% & 0.7% & 0.6% & 1.6% & 1.9% & 0.0% & 0.7% & 0.3% & 1.0% & 0.7% \\ \hline 1/31/12 & 2.7% & 5.1% & 2.5% & 2.1% & 8.0% & 0.0% & 5.1% & 2.7% & 2.4% & 5.1% \\ \hline 2/29/12 & 1.2% & 4.4% & 1.7% & 0.0% & 0.3% & 0.0% & 4.4% & 1.2% & 3.2% & 4.4% \\ \hline 3/31/12 & 2.8% & 3.1% & 0.3% & 0.1% & 1.5% & 0.0% & 3.1% & 2.8% & 0.3% & 3.1% \\ \hline 4/30/12 & 1.3% & 0.9% & 0.6% & 0.2% & 3.8% & 0.0% & 0.9% & 1.3% & 0.5% & 0.9% \\ \hline 5/31/12 & 3.1% & 6.2% & 0.1% & 0.1% & 6.6% & 0.0% & 6.2% & 3.1% & 3.1% & 6.2% \\ \hline 6/30/12 & 1.1% & 3.9% & 0.8% & 0.5% & 1.1% & 0.0% & 3.9% & 1.1% & 2.8% & 3.9% \\ \hline 7/31/12 & 3.4% & 0.8% & 2.6% & 0.0% & 3.1% & 0.0% & 0.8% & 3.4% & 2.6% & 0.8% \\ \hline 8/31/12 & 1.2% & 2.6% & 0.7% & 0.6% & 2.4% & 0.0% & 2.6% & 1.2% & 3.8% & 2.6% \\ \hline 9/30/12 & 1.7% & 2.7% & 0.5% & 1.6% & 1.0% & 0.0% & 2.7% & 1.7% & 1.0% & 2.7% \\ \hline 10/31/12 & 2.6% & 1.8% & 1.1% & 4.2% & 0.1% & 0.0% & 1.8% & 2.6% & 4.4% & 1.8% \\ \hline 11/30/12 & 1.7% & 0.8% & 0.7% & 1.1% & 0.4% & 0.0% & 0.8% & 1.7% & 0.9% & 0.8% \\ \hline 12/31/12 & 0.5% & 1.2% & 1.6% & 3.3% & 2.9% & 0.0% & 1.2% & 0.5% & 1.7% & 1.2% \\ \hline 1/31/13 & 4.9% & 5.6% & 0.5% & 1.3% & 1.9% & 0.0% & 5.6% & 4.9% & =0.7% & 5.6% \\ \hline 2/28/13 & 0.1% & 1.3% & 0.4% & 0.3% & 1.4% & 0.0% & 1.3% & 0.1% & 1.2% & 1.3% \\ \hline 3/31/13 & 0.9% & 4.0% & 0.9% & =0.1% & 2.0% & 0.0% & 4.0% & 0.9% & 3.1% & 4.0% \\ \hline 4/30/13 & 2.1% & 1.6% & 2.4% & 0.4% & 0.3% & 0.0% & 1.6% & 2.1% & 0.5% & 1.6% \\ \hline 5/31/13 & 6.5% & 2.8% & 2.0% & 1.3% & 1.9% & 0.0% & 2.8% & 6.5% & 3.7% & 2.8% \\ \hline 6/30/13 & 0.3% & 1.2% & 1.2% & 0.4% & 0.6% & 0.0% & 1.2% & 0.3% & 0.9% & 1.2% \\ \hline 7/31/13 & 0.1% & 5.7% & 1.9% & 0.7% & 1.8% & 0.0% & 5.7% & 0.1% & 5.6% & 5.7% \\ \hline 8/31/13 & 3.4% & 2.7% & 0.2% & 2.5% & 0.1% & 0.0% & 2.7% & 3.4% & 0.7% & 2.7% \\ \hline 9/30/13 & 2.4% & 3.8% & 2.9% & 1.6% & 3.0% & 0.0% & 3.8% & 2.4% & 1.4% & 3.8% \\ \hline 10/31/13 & 1.8% & 4.2% & 1.6% & 1.4% & 0.1% & 0.0% & 4.2% & 1.8% & 2.4% & 4.2% \\ \hline 11/30/13 & 1.7% & 3.1% & 1.3% & 0.4% & 0.5% & 0.0% & 3.1% & 1.7% & 1.4% & 3.1% \\ \hline 12/31/13 & 1.5% & 2.8% & 0.4% & 0.2% & 0.1% & 0.0% & 2.8% & 1.5% & 1.3% & 2.8% \\ \hline & & & & & & & & & & \\ \hline \end{tabular} \begin{tabular}{|c|c|c|c|c|c|c|c|c|c|c|c|} \hline & A & B & C & D & E & F & G & H & 1 & J & K \\ \hline 1 & mktrf & \multicolumn{4}{|c|}{ Market (value-weighted CRSP) less risk free rate } & & & & & & \\ \hline 2 & smb & \multicolumn{2}{|c|}{ small minus big } & & & & & & & & \\ \hline 3 & hml & \multicolumn{2}{|c|}{ high minus low } & & & & & & & & \\ \hline 4 & rf & risk free & & & & & & & & & \\ \hline 5 & umd & \multicolumn{3}{|c|}{ up minus down (Momentum) } & & & & & & & \\ \hline \multicolumn{12}{|l|}{6} \\ \hline \multicolumn{12}{|l|}{7} \\ \hline \multicolumn{12}{|l|}{8} \\ \hline \multicolumn{12}{|l|}{9} \\ \hline \multicolumn{12}{|l|}{10} \\ \hline \multicolumn{12}{|l|}{11} \\ \hline \multicolumn{12}{|l|}{12} \\ \hline \multicolumn{12}{|l|}{13} \\ \hline \multicolumn{12}{|l|}{14} \\ \hline \multicolumn{12}{|l|}{15} \\ \hline \multicolumn{12}{|l|}{16} \\ \hline \multicolumn{12}{|l|}{17} \\ \hline \multicolumn{12}{|l|}{18} \\ \hline \multicolumn{12}{|l|}{19} \\ \hline \multicolumn{12}{|l|}{20} \\ \hline \multicolumn{12}{|l|}{21} \\ \hline \multicolumn{12}{|l|}{22} \\ \hline \multicolumn{12}{|l|}{23} \\ \hline \multicolumn{12}{|l|}{24} \\ \hline \multicolumn{12}{|l|}{25} \\ \hline \multicolumn{12}{|l|}{26} \\ \hline 27 & & & & & & & & & & & \\ \hline \end{tabular}
Step by Step Solution
There are 3 Steps involved in it
Step: 1

Get Instant Access to Expert-Tailored Solutions
See step-by-step solutions with expert insights and AI powered tools for academic success
Step: 2

Step: 3
Ace Your Homework with AI
Get the answers you need in no time with our AI-driven, step-by-step assistance
Get Started
Dark Finance
Authors: Fabio Mattioli
1st Edition
1503611655, 978-1503611658