

Answered step by step
Verified Expert Solution
Question
1 Approved Answer
The spreadsheet Group Report Data.xlsx contains monthly returns on ten Australian industry indices from January 2016 to July 2021. The industry abbreviations are in
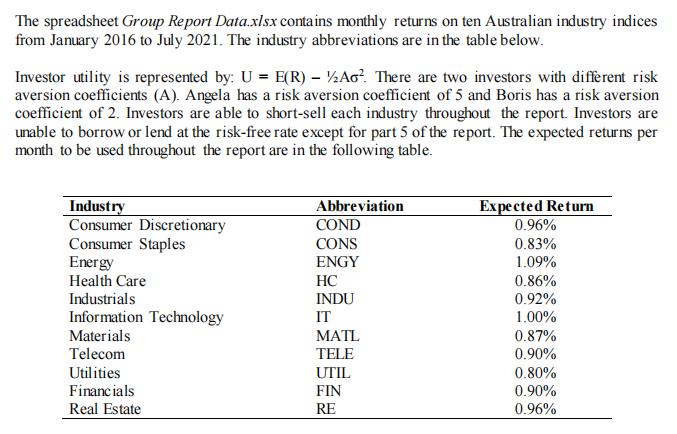
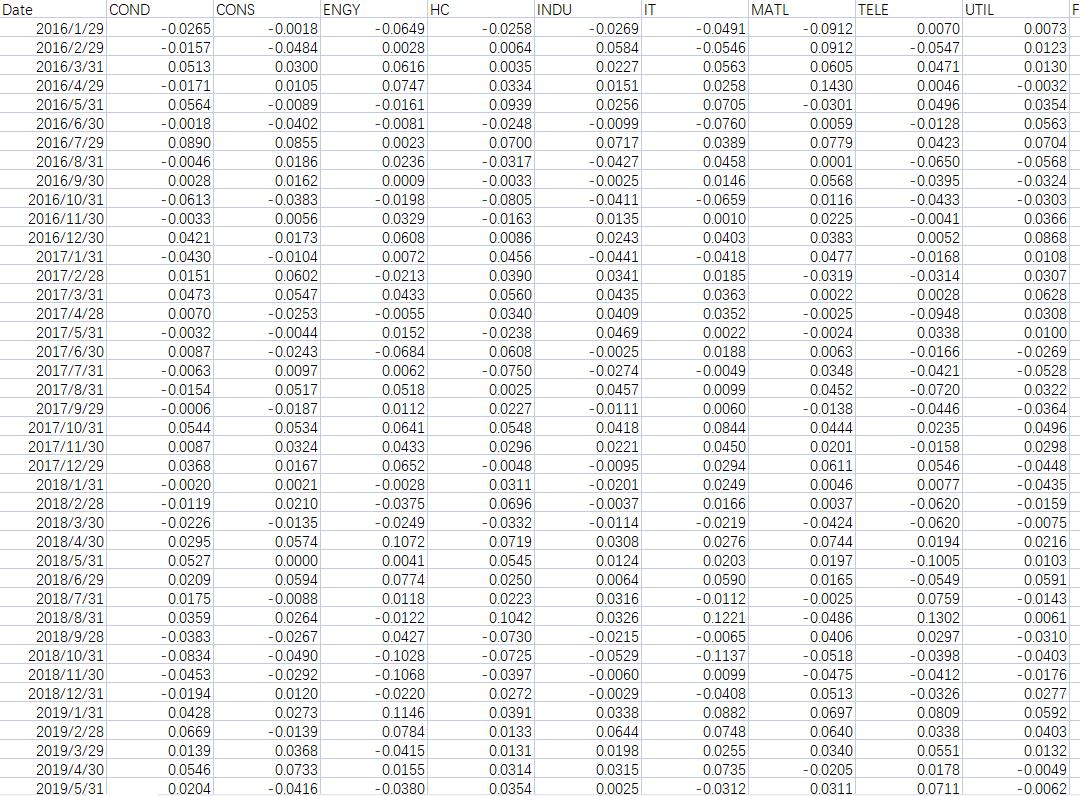
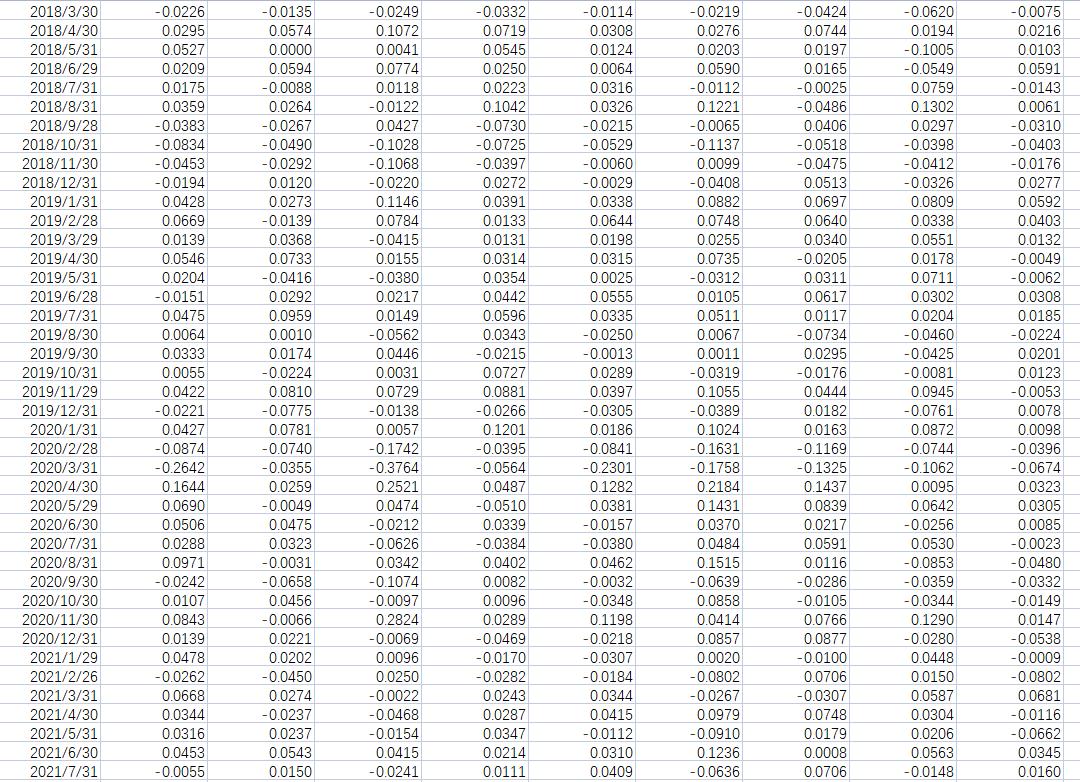
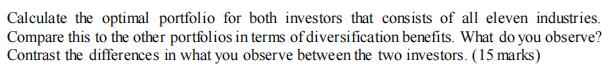
The spreadsheet Group Report Data.xlsx contains monthly returns on ten Australian industry indices from January 2016 to July 2021. The industry abbreviations are in the table below. Investor utility is represented by: U = E(R) Ao?. There are two investors with diffrent risk aversion coefficients (A). Angela has a risk aversion coefficient of 5 and Boris has a risk aversion coefficient of 2. Investors are able to short-sell each industry throughout the report. Investors are unable to borrow or lend at the risk-free rate except for part 5 of the report. The expected returns per month to be used throughout the report are in the following table. Industry Consumer Discretionary Consumer Staples Energy Abbreviation COND Expected Return 0.96% CONS 0.83% ENGY 1.09% Health Care HC 0.86% Industrials INDU 0.92% Information Technology IT 1.00% Materials ATL 0.87% 0.90% Telecom TELE Utilities UTIL 0.80% Financials FIN 0.90% Real Estate RE 0.96% Date COND CONS ENGY HC INDU IT MATL TELE UTIL -0.0018 -0.0649 -0.0912 0.0073 0.0123 2016/1/29 -0.0265 -0.0258 -0.0269 -0.0491 0.0070 2016/2/29 -0.0157 -0.0484 0.0028 0.0064 0.0584 -0.0546 0.0912 -0.0547 2016/3/31 0.0513 0.0300 0.0616 0.0035 0.0227 0.0563 0.0605 0.0471 0.0130 0.0747 0.0151 0.0256 2016/4/29 -0.0171 0.0105 0.0334 0.0258 0.1430 0.0046 -0.0032 2016/5/31 0.0564 -0.0089 -0.0161 0.0939 0.0705 -0.0301 0.0496 0.0354 2016/6/30 -0.0018 -0.0402 -0.0081 -0.0248 -0.0099 -0.0760 0.0059 -0.0128 0.0563 2016/7/29 0.0890 0.0855 0.0023 0.0700 0.0717 0.0389 0.0779 0.0423 0.0704 -0.0046 -0.0317 -0.0427 -0.0025 2016/8/31 0.0186 0.0236 0.0458 0.0001 -0.0650 -0.0568 0.0028 -0.0613 0.0009 0.0568 0.0116 2016/9/30 0.0162 -0.0033 0.0146 -0.0395 -0.0324 -0.0303 0.0366 -0.0383 -0.0198 -0.0805 -0.0163 2016/10/31 -0.0411 -0.0659 -0.0433 -0.0033 0.0421 -0.0430 2016/11/30 0.0135 0.0243 0.0056 0.0329 0.0010 0.0225 -0.0041 2016/12/30 0.0173 0.0608 0.0086 0.0403 0.0383 0.0052 0.0868 0.0456 0.0477 -0.0319 2017/1/31 -0.0104 0.0072 -0.0441 -0.0418 -0.0168 0.0108 0.0307 -0.0314 0.0028 0.0151 0.0341 0.0435 2017/2/28 0.0602 -0.0213 0.0390 0.0185 2017/3/31 0.0473 0.0547 0.0433 0.0560 0.0363 0.0022 0.0628 2017/4/28 0.0070 -0.0253 -0.0055 0.0340 0.0409 0.0352 -0.0025 -0.0948 0.0308 0.0152 -0.0684 2017/5/31 -0.0032 -0.0044 -0.0238 0.0469 0.0022 -0.0024 0.0338 0.0100 2017/6/30 0.0087 -0.0243 0.0063 -0.0269 0.0608 -0.0750 -0.0025 0.0188 -0.0166 2017/7/31 -0.0063 0.0097 0.0062 -0.0274 -0.0049 0.0348 -0.0421 -0.0528 0.0518 0.0099 0.0457 -0.0111 2017/8/31 -0.0154 0.0517 0.0025 0.0452 -0.0720 0.0322 2017/9/29 0.0060 -0.0138 0.0444 -0.0446 -0.0006 0.0544 0.0087 -0.0187 0.0112 0.0227 -0.0364 2017/10/31 0.0534 0.0641 0.0548 0.0418 0.0844 0.0235 0.0496 2017/11/30 0.0324 0.0433 0.0296 0.0221 0.0450 0.0201 -0.0158 0.0298 2017/12/29 0.0368 0.0167 0.0021 0.0210 0.0652 -0.0048 -0.0095 0.0294 0.0611 0.0546 -0.0448 -0.0020 -0.0119 2018/1/31 -0.0028 0.0311 -0.0201 0.0249 0.0046 0.0077 -0.0435 2018/2/28 -0.0375 0.0696 -0.0037 0.0166 0.0037 -0.0620 -0.0159 -0.0620 -0.0114 0.0308 0.0124 -0.0424 0.0744 2018/3/30 -0.0226 -0.0135 -0.0249 -0.0332 -0.0219 -0.0075 0.1072 0.0041 0.0295 0.0574 0.0719 0.0545 2018/4/30 0.0276 0.0194 0.0216 0.0527 0.0209 0.0197 0.0165 2018/5/31 0.0000 0.0203 -0.1005 0.0103 0.0591 -0.0143 0.0061 2018/6/29 0.0594 0.0774 0.0250 0.0064 0.0590 -0.0549 0.0759 0.0175 0.0359 2018/7/31 -0.0088 0.0118 0.0223 0.0316 -0.0112 -0.0025 2018/8/31 0.0264 -0.0122 0.1042 0.0326 0.1221 -0.0486 0.1302 2018/9/28 -0.0383 -0.0267 0.0427 -0.0730 -0.0215 -0.0065 0.0406 0.0297 -0.0310 -0.0834 -0.1028 -0.0529 -0.1137 0.0099 2018/10/31 -0.0490 -0.0725 -0.0518 -0.0398 -0.0403 2018/11/30 -0.0453 -0.0292 -0.1068 -0.0397 -0.0060 -0.0475 -0.0412 -0.0176 2018/12/31 -0.0194 0.0120 -0.0220 0.0272 0.0513 -0.0326 -0.0029 0.0338 -0.0408 0.0277 2019/1/31 0.0428 0.0273 0.1146 0.0391 0.0882 0.0697 0.0809 0.0592 0.0644 0.0198 0.0403 0.0669 0.0139 2019/2/28 -0.0139 0.0784 0.0133 0.0748 0.0640 0.0338 2019/3/29 0.0368 -0.0415 0.0131 0.0255 0.0340 0.0551 0.0132 2019/4/30 0.0546 0.0733 0.0155 0.0314 0.0315 0.0735 -0.0205 0.0178 -0.0049 2019/5/31 0.0204 -0.0416 -0.0380 0.0354 0.0025 -0.0312 0.0311 0.0711 -0.0062 -0.0332 -0.0620 -0.0135 0.0574 -0.0424 0.0744 0.0197 2018/3/30 -0.0226 -0.0249 -0.0114 -0.0219 -0.0075 0.0719 0.0194 -0.1005 2018/4/30 0.0295 0.1072 0.0308 0.0276 0.0216 2018/5/31 0.0527 0.0000 0.0041 0.0545 0.0124 0.0203 0.0103 0.0774 0.0118 0.0250 0.0064 0.0165 -0.0025 -0.0486 2018/6/29 0.0209 0.0594 0.0590 -0.0549 0.0591 2018/7/31 2018/8/31 0.0175 -0.0112 0.1221 -0.0088 0.0223 0.0316 0.0759 -0.0143 0.0359 0.0264 -0.0122 0.1042 0.0326 0.1302 0.0061 2018/9/28 -0.0383 -0.0267 0.0427 -0.0730 -0.0215 -0.0065 0.0406 0.0297 -0.0310 2018/10/31 -0.0834 -0.0490 -0.1028 -0.0725 -0.0529 -0.1137 -0.0518 -0.0398 -0.0403 2018/11/30 -0.0453 -0.0292 -0.1068 -0.0397 -0.0060 0.0099 -0.0475 -0.0412 -0.0176 2018/12/31 0.0120 -0.0220 -0.0029 0.0338 0.0644 -0.0194 0.0272 -0.0408 0.0513 -0.0326 0.0277 0.1146 0.0784 2019/1/31 0.0428 0.0273 0.0391 0.0882 0.0697 0.0809 0.0592 2019/2/28 0.0669 -0.0139 0.0133 0.0748 0.0640 0.0338 0.0403 2019/3/29 0.0139 0.0255 0.0340 0.0132 0.0368 0.0733 -0.0415 0.0131 0.0198 0.0551 2019/4/30 0.0546 0.0155 0.0314 0.0315 0.0735 -0.0205 0.0178 -0.0049 2019/5/31 0.0204 -0.0416 0.0292 -0.0380 0.0354 0.0025 -0.0312 0.0711 -0.0062 0.0311 0.0617 0.0442 0.0596 2019/6/28 -0.0151 0.0217 0.0555 0.0105 0.0302 0.0308 0.0204 -0.0460 2019/7/31 0.0475 0.0959 0.0149 0.0335 0.0511 0.0117 0.0185 2019/8/30 0.0064 0.0010 -0.0562 0.0343 -0.0250 0.0067 -0.0734 -0.0224 2019/9/30 0.0333 0.0174 0.0446 -0.0215 -0.0013 0.0011 0.0295 -0.0425 0.0201 2019/10/31 0.0055 -0.0224 0.0031 0.0727 0.0289 -0.0319 -0.0176 -0.0081 0.0123 0.1055 -0.0389 2019/11/29 0.0422 0.0810 0.0729 0.0881 0.0397 0.0444 0.0945 -0.0053 2019/12/31 -0.0221 -0.0775 -0.0138 -0.0266 -0.0305 0.0182 -0.0761 0.0078 2020/1/31 0.0427 0.0781 0.0057 0.1201 0.0186 0.1024 0.0163 0.0872 0.0098 -0.0874 -0.2642 0.1644 -0.0740 -0.0355 0.0259 -0.1742 -0.3764 0.2521 -0.0395 -0.0564 -0.0744 -0.1062 -0.0841 -0.1631 -0.1169 -0.1325 2020/2/28 -0.0396 -0.0674 0.0323 2020/3/31 -0.2301 -0.1758 2020/4/30 0.0487 0.1282 0.2184 0.1437 0.0095 0.0642 -0.0256 2020/5/29 0.0690 -0.0049 0.0474 -0.0510 0.0381 0.1431 0.0839 0.0305 0.0339 -0.0384 2020/6/30 0.0506 0.0475 -0.0212 -0.0157 0.0370 0.0217 0.0085 0.0484 0.0591 0.0116 2020/7/31 0.0288 0.0323 -0.0626 0.0342 -0.0380 0.0530 -0.0023 2020/8/31 0.0971 -0.0031 0.0402 0.0462 0.1515 -0.0853 -0.0480 2020/9/30 -0.0242 -0.0658 -0.1074 0.0082 -0.0032 -0.0639 -0.0286 -0.0359 -0.0332 2020/10/30 0.0107 0.0456 -0.0097 0.0096 -0.0348 0.0858 -0.0105 -0.0344 -0.0149 2020/11/30 0.0843 -0.0066 0.2824 0.0289 0.1198 0.0414 0.0766 0.1290 0.0147 2020/12/31 0.0139 0.0221 -0.0069 -0.0469 -0.0218 0.0857 0.0877 -0.0280 -0.0538 2021/1/29 0.0478 0.0202 0.0096 -0.0170 -0.0307 0.0020 -0.0100 0.0448 -0.0009 2021/2/26 -0.0262 -0.0450 0.0250 -0.0282 -0.0184 -0.0802 0.0706 -0.0307 0.0150 -0.0802 2021/3/31 0.0668 0.0274 -0.0022 0.0243 0.0344 -0.0267 0.0587 0.0681 0.0748 0.0179 2021/4/30 -0.0237 -0.0468 -0.0154 0.0344 0.0304 0.0287 0.0347 0.0415 0.0979 -0.0116 2021/5/31 0.0316 0.0237 -0.0112 -0.0910 0.0206 -0.0662 2021/6/30 0.0453 0.0543 0.0415 0.0214 0.0310 0.1236 0.0008 0.0563 0.0345 2021/7/31 -0.0055 0.0150 -0.0241 0.0111 0.0409 -0.0636 0.0706 -0.0148 0.0160 Calculate the optimal portfolio for both investors that consists of all eleven industries. Compare this to the other portfolios in terms of diversification benefits. What do you observe? Contrast the differences in what you observe between the two investors. (15 marks)
Step by Step Solution
★★★★★
3.35 Rating (142 Votes )
There are 3 Steps involved in it
Step: 1
Answer i Industries with the highest utility will have a better return risk tradeoff ii Based on this reason we can select the highest utility industr...
Get Instant Access to Expert-Tailored Solutions
See step-by-step solutions with expert insights and AI powered tools for academic success
Step: 2

Step: 3
Ace Your Homework with AI
Get the answers you need in no time with our AI-driven, step-by-step assistance
Get Started
Data Analysis And Decision Making
Authors: Christian Albright, Wayne Winston, Christopher Zappe
4th Edition
538476125, 978-0538476126