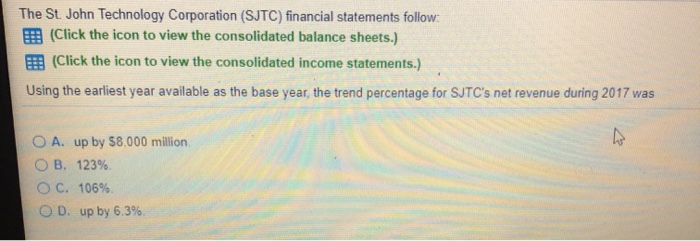
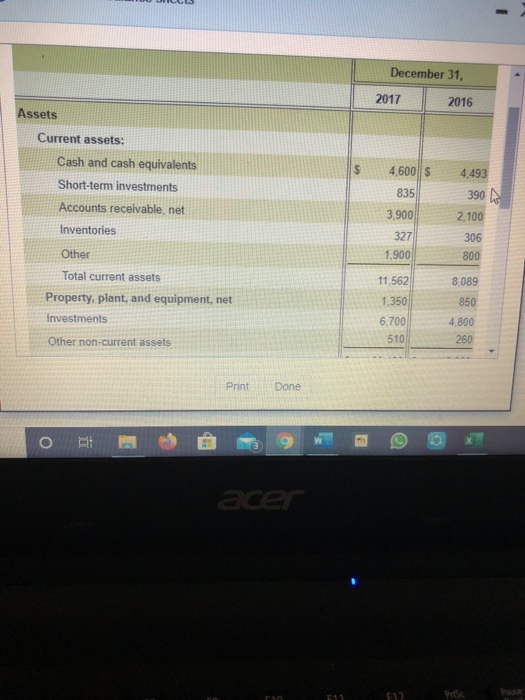
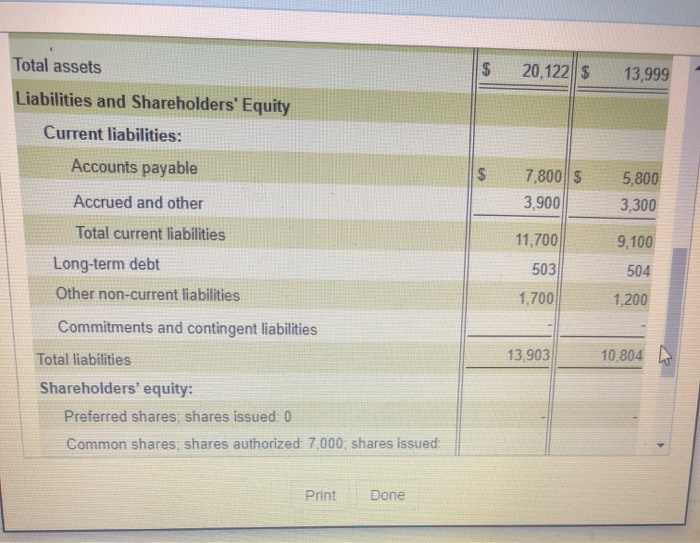
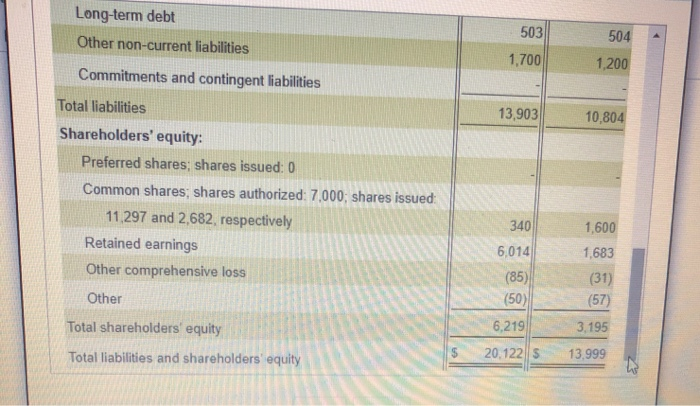
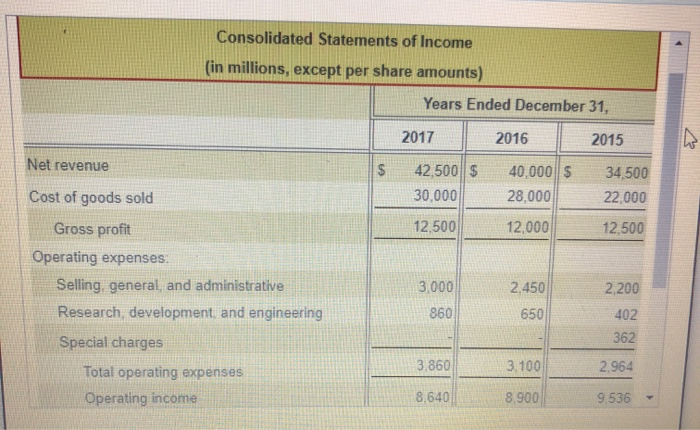
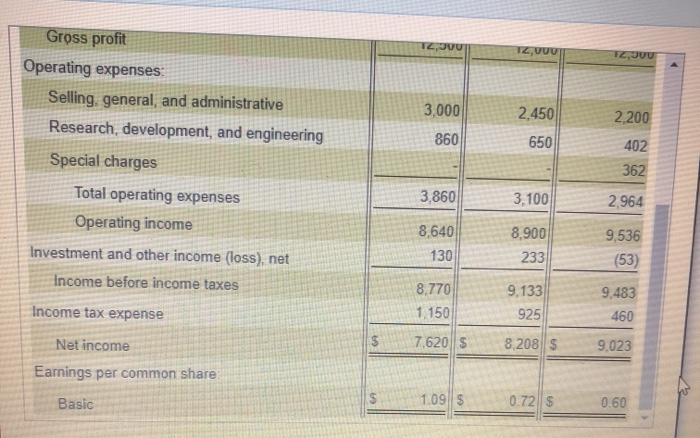
The St. John Technology Corporation (SJTC) financial statements follow: E (Click the icon to view the consolidated balance sheets.) E (Click the icon to view the consolidated income statements.) Using the earliest year available as the base year, the trend percentage for SJTC's net revenue during 2017 was O A. up by 58,000 million OB. 123% O C. 106% OD up by 6.3% December 31, 2017 2016 Assets $ 4,493 4.600 $ 835 390 W 3,900 327 Current assets: Cash and cash equivalents Short-term investments Accounts receivable, net Inventories Other Total current assets Property, plant, and equipment, net Investments Other non-current assets 2,100 306 800 1,900 8,089 11,562 1,350 850 4 800 6.700 510 260 Print Done acer 512 Pase Total assets $ 20,122 $ 13,999 Liabilities and Shareholders' Equity Current liabilities: Accounts payable $ 7,800 $ 3,900 5,800 3,300 Accrued and other 11,700 9,100 Total current liabilities Long-term debt Other non-current liabilities 503 504 1,700 1.200 Commitments and contingent liabilities 13,903 10,804 W Total liabilities Shareholders' equity: Preferred shares shares issued: 0 Common shares: shares authorized: 7,000 shares issued: Print Done Long-term debt Other non-current liabilities 503 504 1,700 1,200 Commitments and contingent liabilities Total liabilities 13,903 10,804 Shareholders' equity: Preferred shares; shares issued: 0 Common shares; shares authorized: 7,000; shares issued: 11,297 and 2,682, respectively Retained earnings Other comprehensive loss 340 6,014 1,600 1,683 (31) (57) (85) Other (50) Total shareholders' equity 6,219 3.195 Total liabilities and shareholders' equity $ 20.1225 13,999 Consolidated Statements of Income (in millions, except per share amounts) Years Ended December 31, 2017 2016 2015 Net revenue $ 42.500||$ 30,000 40,000 $ 28,000 34,500 22.000 12.500 12.000 12,500 Cost of goods sold Gross profit Operating expenses Selling, general, and administrative Research, development, and engineering Special charges Total operating expenses Operating income 3.000 860 2.450 650 2,200 402 362 3.860 3.100 2.964 8,640 8,900 9,536 TZ, JUU IZVUUT 12,JUU 2,450 3,000 860 2,200 650 402 Gross profit Operating expenses Selling, general, and administrative Research, development, and engineering Special charges Total operating expenses Operating income Investment and other income (loss), net Income before income taxes 362 3,860 3.100 2,964 8,640 130 8.900 233 9,536 (53) 8.770 1.150 Income tax expense 9,133 925 9,483 460 Net income GA 7,620$ 8,208 $ 9,023 Earnings per common share Basic $ 1.09 $ 0.72$ 0.60
