

Answered step by step
Verified Expert Solution
Question
1 Approved Answer
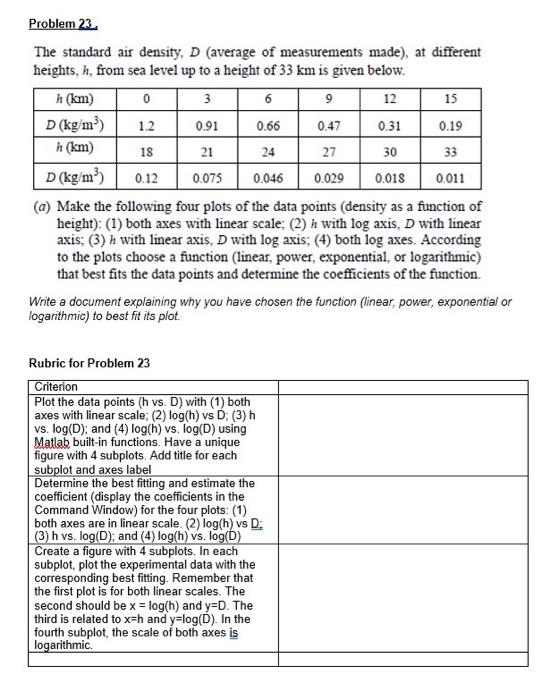
The standard air density, D (average of measurements made), at different heights, h, from sea level up to a height of 33km is given below.
Step by Step Solution
There are 3 Steps involved in it
Step: 1

Get Instant Access to Expert-Tailored Solutions
See step-by-step solutions with expert insights and AI powered tools for academic success
Step: 2

Step: 3
Ace Your Homework with AI
Get the answers you need in no time with our AI-driven, step-by-step assistance
Get Started
Elementary Principles of Chemical Processes
Authors: Richard M. Felder, Ronald W. Rousseau
3rd Edition
978-0471687573, 9788126515820, 978-0-471-4152, 0471720631, 047168757X, 8126515821, 978-0471720638