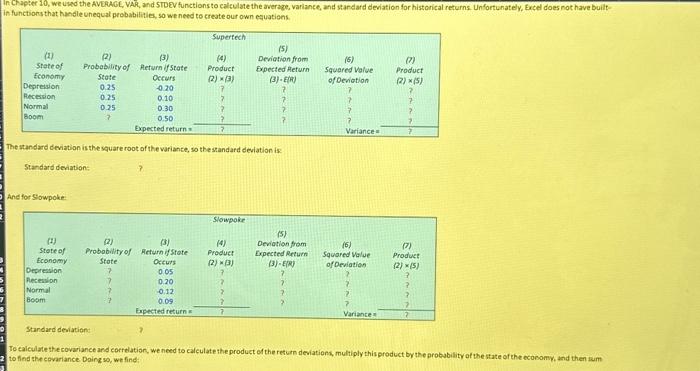
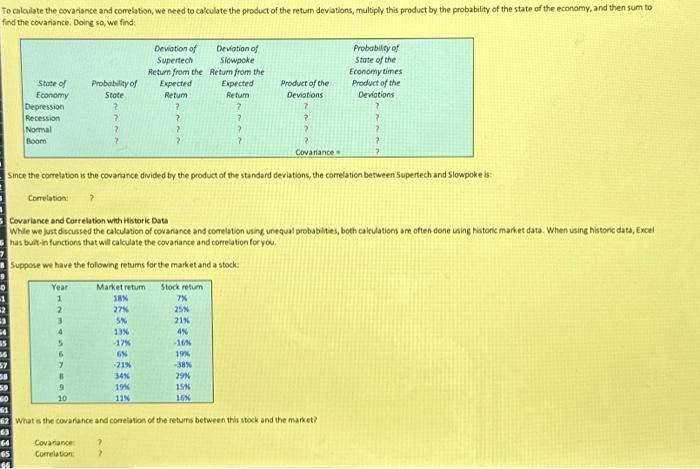
The standard deviation is the square root of the variance, so the standard deviation is: Siandard deviation: 7 Ane for Slowpoke: Stardard deviation: To eaiculate the covariance and eorrelation, we need to calculate the product of the return deviations, multiply this product by the probubility of the state of the ecosomy, and then ium to find the covariance Doing so, we find: To calculate the covariance and comelation, we need to calculate the product of the retum devations, multiply this product by the probability of the state of the economy, and then sum to find the covariance. Doine so, we find: Since the comelation is the covariance divided by the product of the standard deviations, the correlaticn between Supertech and Slowpoke is: Cortation: ? Covariance and Correlaton with Hotoric Data While we just discussed the calculation of covarance and conelabon using unequal probablites, both cakuations are often done using fistonic market data. When using histonc data, Excel has buat in functions that will calculate the covariance and correlation for you. Suppose we have the folowing retums for the market and a stock: What s the covarince and corretation of the retums between this stock and the market? Covariance: ? Correlation ? The standard deviation is the square root of the variance, so the standard deviation is: Siandard deviation: 7 Ane for Slowpoke: Stardard deviation: To eaiculate the covariance and eorrelation, we need to calculate the product of the return deviations, multiply this product by the probubility of the state of the ecosomy, and then ium to find the covariance Doing so, we find: To calculate the covariance and comelation, we need to calculate the product of the retum devations, multiply this product by the probability of the state of the economy, and then sum to find the covariance. Doine so, we find: Since the comelation is the covariance divided by the product of the standard deviations, the correlaticn between Supertech and Slowpoke is: Cortation: ? Covariance and Correlaton with Hotoric Data While we just discussed the calculation of covarance and conelabon using unequal probablites, both cakuations are often done using fistonic market data. When using histonc data, Excel has buat in functions that will calculate the covariance and correlation for you. Suppose we have the folowing retums for the market and a stock: What s the covarince and corretation of the retums between this stock and the market? Covariance: ? Correlation


