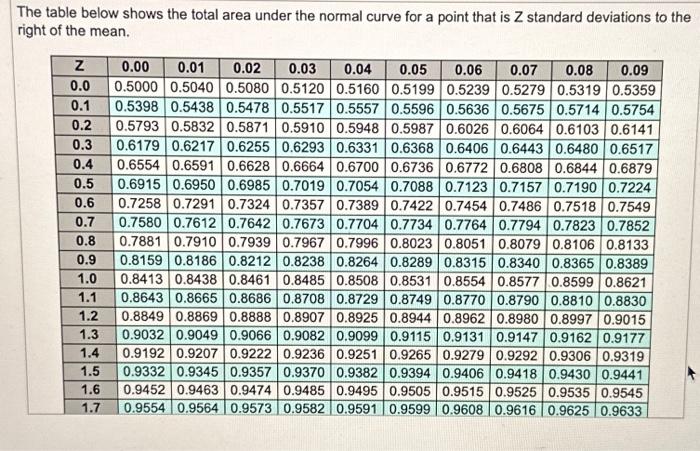
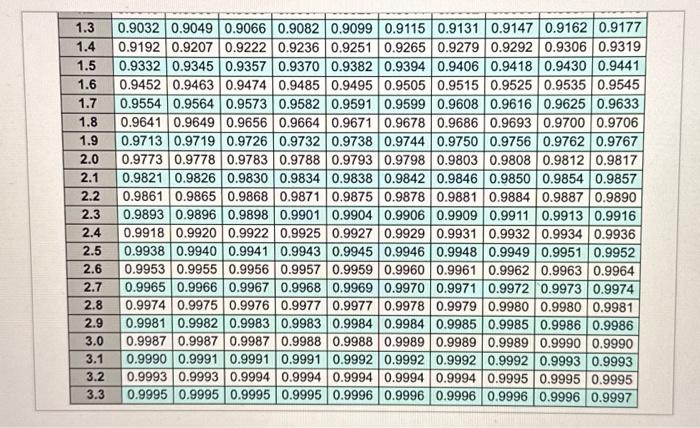
The standard deviation of demand during the 7 -week lead time is 26 pints. (Enter your response rounded to the nearest whole number.) The average demand during the 7 -week lead time is pints. (Enter your response as an integer.) c. The reorder point that results in a cycle-service level of 90 percent is 2,168 pints. (Enter your response rounded to the nearest whole number.) In a Q system, the demand rate for strawberry ice cream is normally distributed, with an average of 295 pints per week. The lead time is 7 weeks. The standard deviation of weekly demand is 16 pints. Refer to the standard normal table for z-values. a. The standard deviation of demand during the 7-week lead time is pints. (Enter your response rounded to the nearest whole number.) The table below shows the total area under the normal curve for a point that is Z standard deviations to the right of the mean. \begin{tabular}{|l|l|l|l|l|l|l|l|l|l|l|} \hline 1.3 & 0.9032 & 0.9049 & 0.9066 & 0.9082 & 0.9099 & 0.9115 & 0.9131 & 0.9147 & 0.9162 & 0.9177 \\ \hline 1.4 & 0.9192 & 0.9207 & 0.9222 & 0.9236 & 0.9251 & 0.9265 & 0.9279 & 0.9292 & 0.9306 & 0.9319 \\ \hline 1.5 & 0.9332 & 0.9345 & 0.9357 & 0.9370 & 0.9382 & 0.9394 & 0.9406 & 0.9418 & 0.9430 & 0.9441 \\ \hline 1.6 & 0.9452 & 0.9463 & 0.9474 & 0.9485 & 0.9495 & 0.9505 & 0.9515 & 0.9525 & 0.9535 & 0.9545 \\ \hline 1.7 & 0.9554 & 0.9564 & 0.9573 & 0.9582 & 0.9591 & 0.9599 & 0.9608 & 0.9616 & 0.9625 & 0.9633 \\ \hline 1.8 & 0.9641 & 0.9649 & 0.9656 & 0.9664 & 0.9671 & 0.9678 & 0.9686 & 0.9693 & 0.9700 & 0.9706 \\ \hline 1.9 & 0.9713 & 0.9719 & 0.9726 & 0.9732 & 0.9738 & 0.9744 & 0.9750 & 0.9756 & 0.9762 & 0.9767 \\ \hline 2.0 & 0.9773 & 0.9778 & 0.9783 & 0.9788 & 0.9793 & 0.9798 & 0.9803 & 0.9808 & 0.9812 & 0.9817 \\ \hline 2.1 & 0.9821 & 0.9826 & 0.9830 & 0.9834 & 0.9838 & 0.9842 & 0.9846 & 0.9850 & 0.9854 & 0.9857 \\ \hline 2.2 & 0.9861 & 0.9865 & 0.9868 & 0.9871 & 0.9875 & 0.9878 & 0.9881 & 0.9884 & 0.9887 & 0.9890 \\ \hline 2.3 & 0.9893 & 0.9896 & 0.9898 & 0.9901 & 0.9904 & 0.9906 & 0.9909 & 0.9911 & 0.9913 & 0.9916 \\ \hline 2.4 & 0.9918 & 0.9920 & 0.9922 & 0.9925 & 0.9927 & 0.9929 & 0.9931 & 0.9932 & 0.9934 & 0.9936 \\ \hline 2.5 & 0.9938 & 0.9940 & 0.9941 & 0.9943 & 0.9945 & 0.9946 & 0.9948 & 0.9949 & 0.9951 & 0.9952 \\ \hline 2.6 & 0.9953 & 0.9955 & 0.9956 & 0.9957 & 0.9959 & 0.9960 & 0.9961 & 0.9962 & 0.9963 & 0.9964 \\ \hline 2.7 & 0.9965 & 0.9966 & 0.9967 & 0.9968 & 0.9969 & 0.9970 & 0.9971 & 0.9972 & 0.9973 & 0.9974 \\ \hline 2.8 & 0.9974 & 0.9975 & 0.9976 & 0.9977 & 0.9977 & 0.9978 & 0.9979 & 0.9980 & 0.9980 & 0.9981 \\ \hline 2.9 & 0.9981 & 0.9982 & 0.9983 & 0.9983 & 0.9984 & 0.9984 & 0.9985 & 0.9985 & 0.9986 & 0.9986 \\ \hline 3.0 & 0.9987 & 0.9987 & 0.9987 & 0.9988 & 0.9988 & 0.9989 & 0.9989 & 0.9989 & 0.9990 & 0.9990 \\ \hline 3.1 & 0.9990 & 0.9991 & 0.9991 & 0.9991 & 0.9992 & 0.9992 & 0.9992 & 0.9992 & 0.9993 & 0.9993 \\ \hline 3.2 & 0.9993 & 0.9993 & 0.9994 & 0.9994 & 0.9994 & 0.9994 & 0.9994 & 0.9995 & 0.9995 & 0.9995 \\ \hline 3.3 & 0.9995 & 0.9995 & 0.9995 & 0.9995 & 0.9996 & 0.9996 & 0.9996 & 0.9996 & 0.9996 & 0.9997 \\ \hline \end{tabular}


