-
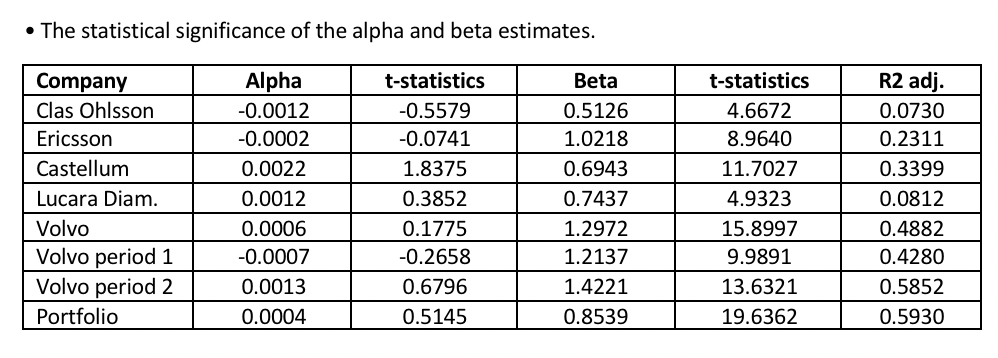
The statistical significance of the alpha and beta estimates.
-
How the stocks performed during the sample period compared to
what CAPM predicts. Hint: you should look at the alpha of the regression. And remember that you are looking at weekly return data.
-
If the betas and the statistical significance of the estimates for Volvo changed when splitting into two estimation periods.
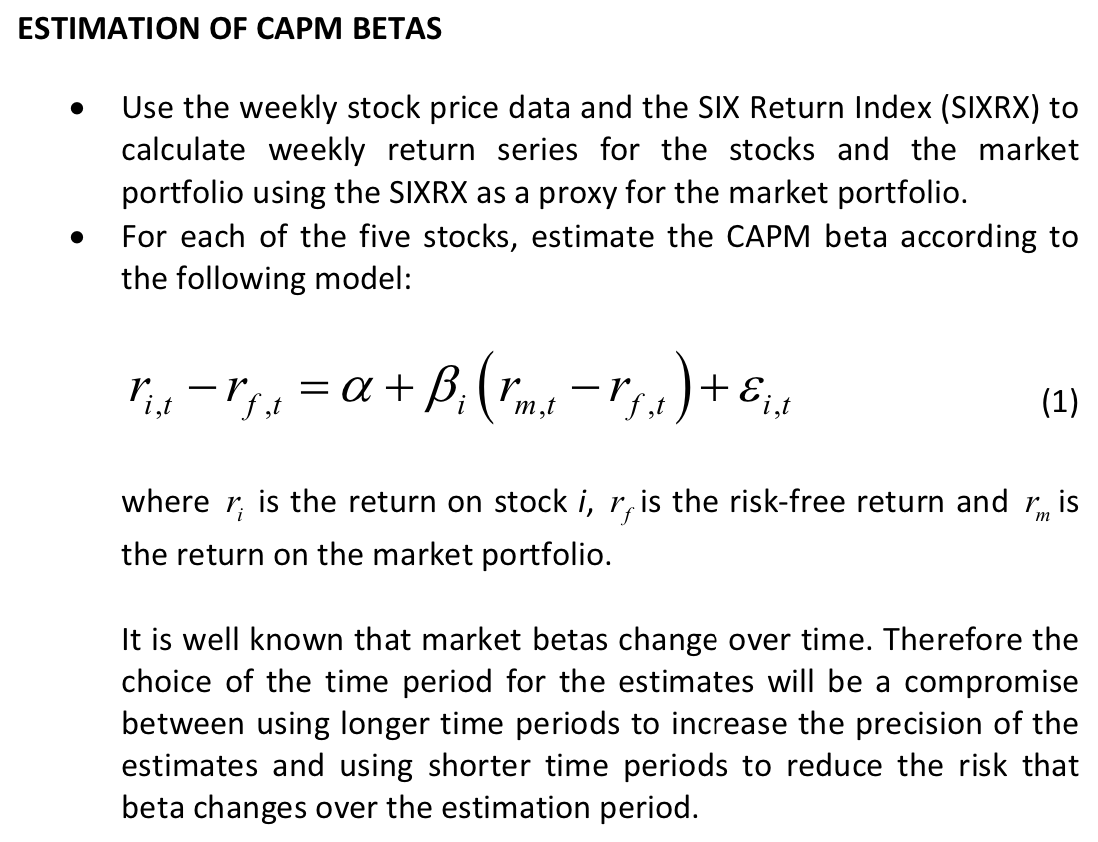
ESTIMATION OF CAPM BETAS Use the weekly stock price data and the Six Return Index (SIXRX) to calculate weekly return series for the stocks and the market portfolio using the SIXRX as a proxy for the market portfolio. For each of the five stocks, estimate the CAPM beta according to the following model: 10-P7, = a +B;(m,1 r;.1)+Ex (1) where r; is the return on stock i, r, is the risk-free return and rm is the return on the market portfolio. It is well known that market betas change over time. Therefore the choice of the time period for the estimates will be a compromise between using longer time periods to increase the precision of the estimates and using shorter time periods to reduce the risk that beta changes over the estimation period. The statistical significance of the alpha and beta estimates. Company Clas Ohlsson Ericsson Castellum Lucara Diam. Volvo Volvo period 1 Volvo period 2 Portfolio Alpha -0.0012 -0.0002 0.0022 0.0012 0.0006 -0.0007 0.0013 0.0004 t-statistics -0.5579 -0.0741 1.8375 0.3852 0.1775 -0.2658 0.6796 0.5145 Beta 0.5126 1.0218 0.6943 0.7437 1.2972 1.2137 1.4221 0.8539 t-statistics 4.6672 8.9640 11.7027 4.9323 15.8997 9.9891 13.6321 19.6362 R2 adj. 0.0730 0.2311 0.3399 0.0812 0.4882 0.4280 0.5852 0.5930 ESTIMATION OF CAPM BETAS Use the weekly stock price data and the Six Return Index (SIXRX) to calculate weekly return series for the stocks and the market portfolio using the SIXRX as a proxy for the market portfolio. For each of the five stocks, estimate the CAPM beta according to the following model: 10-P7, = a +B;(m,1 r;.1)+Ex (1) where r; is the return on stock i, r, is the risk-free return and rm is the return on the market portfolio. It is well known that market betas change over time. Therefore the choice of the time period for the estimates will be a compromise between using longer time periods to increase the precision of the estimates and using shorter time periods to reduce the risk that beta changes over the estimation period. The statistical significance of the alpha and beta estimates. Company Clas Ohlsson Ericsson Castellum Lucara Diam. Volvo Volvo period 1 Volvo period 2 Portfolio Alpha -0.0012 -0.0002 0.0022 0.0012 0.0006 -0.0007 0.0013 0.0004 t-statistics -0.5579 -0.0741 1.8375 0.3852 0.1775 -0.2658 0.6796 0.5145 Beta 0.5126 1.0218 0.6943 0.7437 1.2972 1.2137 1.4221 0.8539 t-statistics 4.6672 8.9640 11.7027 4.9323 15.8997 9.9891 13.6321 19.6362 R2 adj. 0.0730 0.2311 0.3399 0.0812 0.4882 0.4280 0.5852 0.5930