Answered step by step
Verified Expert Solution
Question
1 Approved Answer
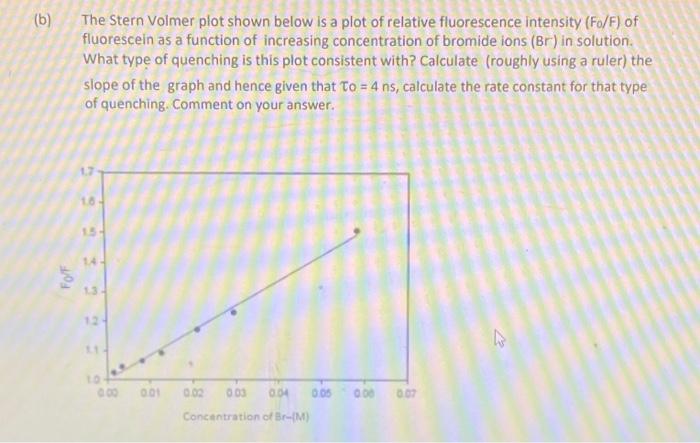
The Stern Volmer plot shown below is a plot of relative fluorescence intensity (Fo/F) of fluorescein as a function of increasing concentration of bromide ions
The Stern Volmer plot shown below is a plot of relative fluorescence intensity (Fo/F) of fluorescein as a function of increasing concentration of bromide ions (Br) in solution.
What type of quenching is this plot consistent with? Calculate (roughly using a ruler) the slope of the graph and hence given that To = 4 ns, calculate the rate constant for that type of quenching. Comment on your answer.

Step by Step Solution
There are 3 Steps involved in it
Step: 1

Get Instant Access to Expert-Tailored Solutions
See step-by-step solutions with expert insights and AI powered tools for academic success
Step: 2

Step: 3

Ace Your Homework with AI
Get the answers you need in no time with our AI-driven, step-by-step assistance
Get Started


