The stock of James Tool sells for $81.20 per share. Its current dividend rate, D0, is $3 per share. Analysts and investors expect James to increase its dividends at a 20 percent rate for each of the next 2 years. This annual dividend growth rate is expected to decline to 17 percent for years 3 and 4 and then to settle down to 13 percent per year forever. Calculate the cost of internal equity for James Tool. Use Table II for your calculations. Round your answer to the nearest whole number.
a.) ?%
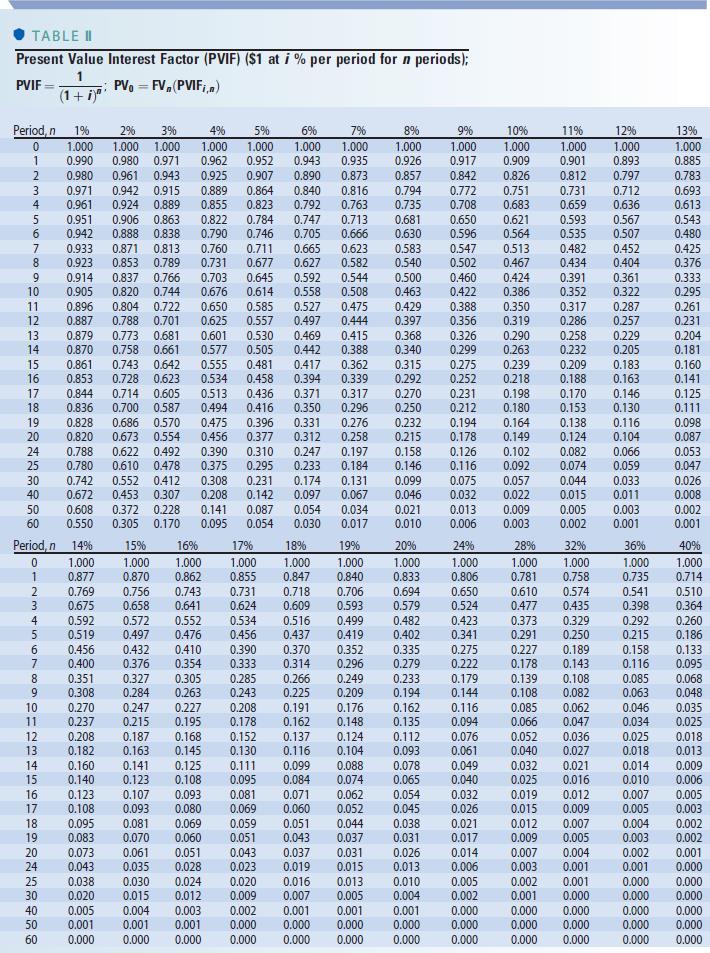
TABLE Present Value Interest Factor (PVIF) ($1 at i % per period for n periods); PVIF : PV= FV,(PVIF;,n) (1 + i)" 7% 1.000 0.935 0.873 0.816 0.763 0.713 0.666 0.623 0.582 0.544 0.508 0.475 0.444 0.415 0.388 0.362 0.339 0.317 0.296 0.276 0.258 0.197 0.184 0.131 0.067 0.034 0.017 13% 1.000 0.885 0.783 0.693 0.613 0.543 0.480 0.425 0.376 0.333 0.295 0.261 0.231 0.204 0.181 0.160 0.141 0.125 0.111 0.098 0.087 0.053 0.047 0.026 0.008 0.002 0.001 Period, 1% 2% 3% 4% 5% 6% 0 1.000 1.000 1.000 1.000 1.000 1.000 1 0.990 0.980 0.971 0.962 0.952 0.943 2 0.980 0.961 0.943 0.925 0.907 0.890 3 0.971 0.942 0.915 0.889 0.864 0.840 4 0.961 0.924 0.889 0.855 0.823 0.792 5 0.951 0.906 0.863 0.822 0.784 0.747 6 0.942 0.888 0.838 0.790 0.746 0.705 7 0.933 0.871 0.813 0.760 0.711 0.665 8 0.923 0.853 0.789 0.731 0.677 0.627 9 0.914 0.837 0.766 0.703 0.645 0.592 10 0.905 0.820 0.744 0.676 0.614 0.558 11 0.896 0.804 0.722 0.650 0.585 0.527 12 0.887 0.788 0.701 0.625 0.557 0.497 13 0.879 0.773 0.681 0.601 0.530 0.469 14 0.870 0.758 0.661 0.577 0.505 0.442 15 0.861 0.743 0.642 0.555 0.481 0.417 16 0.853 0.728 0.623 0.534 0.458 0.394 17 0.844 0.714 0.605 0.513 0.436 0.371 18 0.836 0.700 0.587 0.494 0.416 0.350 19 0.828 0.686 0.570 0.475 0.396 0.331 20 0.820 0.673 0.554 0.456 0.377 0.312 24 0.788 0.622 0.492 0.390 0.310 0.247 25 0.780 0.610 0.478 0.375 0.295 0.233 30 0.742 0.552 0.412 0.308 0.231 0.174 40 0.672 0.453 0.307 0.208 0.142 0.097 50 0.608 0.372 0.228 0.141 0.087 0.054 60 0.550 0.305 0.170 0.095 0.054 0.030 Period, n 14% 15% 16% 17% 18% 0 1.000 1.000 1.000 1.000 1.000 1 0.877 0.870 0.862 0.855 0.847 2 0.769 0.756 0.743 0.731 0.718 3 0.675 0.658 0.641 0.624 0.609 4 0.592 0.572 0.552 0.534 0.516 5 0.519 0.497 0.476 0.456 0.437 6 0.456 0.432 0.410 0.390 0.370 7 0.400 0.376 0.354 0.333 0.314 8 0.351 0.327 0.305 0.285 0.266 9 0.308 0.284 0.263 0.243 0.225 10 0.270 0.247 0.227 0.208 0.191 11 0.237 0.215 0.195 0.178 0.162 12 0.208 0.187 0.168 0.152 0.137 13 0.182 0.163 0.145 0.130 0.116 14 0.160 0.141 0.125 0.111 0.099 15 0.140 0.123 0.108 0.095 0.084 16 0.123 0.107 0.093 0.081 0.071 17 0.108 0.093 0.080 0.069 0.060 18 0.095 0.081 0.069 0.059 0.051 19 0.083 0.070 0.060 0.051 0.043 20 0.073 0.061 0.051 0.043 0.037 24 0.043 0.035 0.028 0.023 0.019 25 0.038 0.030 0.024 0.020 0.016 30 0.020 0.015 0.012 0.009 0.007 40 0.005 0.004 0.003 0.002 0.001 50 0.001 0.001 0.001 0.000 0.000 60 0.000 0.000 0.000 0.000 0.000 8% 1.000 0.926 0.857 0.794 0.735 0.681 0.630 0.583 0.540 0.500 0.463 0.429 0.397 0.368 0.340 0.315 0.292 0.270 0.250 0.232 0.215 0.158 0.146 0.099 0.046 0.021 0.010 20% 1.000 0.833 0.694 0.579 0.482 0.402 0.335 0.279 0.233 0.194 0.162 0.135 0.112 0.093 0.078 0.065 0.054 0.045 0.038 0.031 0.026 0.013 0.010 0.004 0.001 0.000 0.000 9% 10% 1.000 1.000 0.917 0.909 0.842 0.826 0.772 0.751 0.708 0.683 0.650 0.621 0.596 0.564 0.547 0.513 0.502 0.467 0.460 0.424 0.422 0.386 0.388 0.350 0.356 0.319 0.326 0.290 0.299 0.263 0.275 0.239 0.252 0.218 0.231 0.198 0.212 0.180 0.194 0.164 0.178 0.149 0.126 0.102 0.116 0.092 0.075 0.057 0.032 0.022 0.013 0.009 0.006 0.003 24% 28% 1.000 1.000 0.806 0.781 0.650 0.610 0.524 0.477 0.423 0.373 0.341 0.291 0.275 0.227 0.222 0.178 0.179 0.139 0.144 0.108 0.116 0.085 0.094 0.066 0.076 0.052 0.061 0.040 0.049 0.032 0.040 0.025 0.032 0.019 0.026 0.015 0.021 0.012 0.017 0.009 0.014 0.007 0.006 0.003 0.005 0.002 0.002 0.001 0.000 0.000 0.000 0.000 0.000 0.000 11% 1.000 0.901 0.812 0.731 0.659 0.593 0.535 0.482 0.434 0.391 0.352 0.317 0.286 0.258 0.232 0.209 0.188 0.170 0.153 0.138 0.124 0.082 0.074 0.044 0.015 0.005 0.002 32% 1.000 0.758 0.574 0.435 0.329 0.250 0.189 0.143 0.108 0.082 0.062 0.047 0.036 0.027 0.021 0.016 0.012 0.009 0.007 0.005 0.004 0.001 0.001 0.000 0.000 0.000 0.000 12% 1.000 0.893 0.797 0.712 0.636 0.567 0.507 0.452 0.404 0.361 0.322 0.287 0.257 0.229 0.205 0.183 0.163 0.146 0.130 0.116 0.104 0.066 0.059 0.033 0.011 0.003 0.001 36% 1.000 0.735 0.541 0.398 0.292 0.215 0.158 0.116 0.085 0.063 0.046 0.034 0.025 0.018 0.014 0.010 0.007 0.005 0.004 0.003 0.002 0.001 0.000 0.000 0.000 0.000 0.000 19% 1.000 0.840 0.706 0.593 0.499 0.419 0.352 0.296 0.249 0.209 0.176 0.148 0.124 0.104 0.088 0.074 0.062 0.052 0.044 0.037 0.031 0.015 0.013 0.005 0.001 0.000 0.000 40% 1.000 0.714 0.510 0.364 0.260 0.186 0.133 0.095 0.068 0.048 0.035 0.025 0.018 0.013 0.009 0.006 0.005 0.003 0.002 0.002 0.001 0.000 0.000 0.000 0.000 0.000 0.000 TABLE Present Value Interest Factor (PVIF) ($1 at i % per period for n periods); PVIF : PV= FV,(PVIF;,n) (1 + i)" 7% 1.000 0.935 0.873 0.816 0.763 0.713 0.666 0.623 0.582 0.544 0.508 0.475 0.444 0.415 0.388 0.362 0.339 0.317 0.296 0.276 0.258 0.197 0.184 0.131 0.067 0.034 0.017 13% 1.000 0.885 0.783 0.693 0.613 0.543 0.480 0.425 0.376 0.333 0.295 0.261 0.231 0.204 0.181 0.160 0.141 0.125 0.111 0.098 0.087 0.053 0.047 0.026 0.008 0.002 0.001 Period, 1% 2% 3% 4% 5% 6% 0 1.000 1.000 1.000 1.000 1.000 1.000 1 0.990 0.980 0.971 0.962 0.952 0.943 2 0.980 0.961 0.943 0.925 0.907 0.890 3 0.971 0.942 0.915 0.889 0.864 0.840 4 0.961 0.924 0.889 0.855 0.823 0.792 5 0.951 0.906 0.863 0.822 0.784 0.747 6 0.942 0.888 0.838 0.790 0.746 0.705 7 0.933 0.871 0.813 0.760 0.711 0.665 8 0.923 0.853 0.789 0.731 0.677 0.627 9 0.914 0.837 0.766 0.703 0.645 0.592 10 0.905 0.820 0.744 0.676 0.614 0.558 11 0.896 0.804 0.722 0.650 0.585 0.527 12 0.887 0.788 0.701 0.625 0.557 0.497 13 0.879 0.773 0.681 0.601 0.530 0.469 14 0.870 0.758 0.661 0.577 0.505 0.442 15 0.861 0.743 0.642 0.555 0.481 0.417 16 0.853 0.728 0.623 0.534 0.458 0.394 17 0.844 0.714 0.605 0.513 0.436 0.371 18 0.836 0.700 0.587 0.494 0.416 0.350 19 0.828 0.686 0.570 0.475 0.396 0.331 20 0.820 0.673 0.554 0.456 0.377 0.312 24 0.788 0.622 0.492 0.390 0.310 0.247 25 0.780 0.610 0.478 0.375 0.295 0.233 30 0.742 0.552 0.412 0.308 0.231 0.174 40 0.672 0.453 0.307 0.208 0.142 0.097 50 0.608 0.372 0.228 0.141 0.087 0.054 60 0.550 0.305 0.170 0.095 0.054 0.030 Period, n 14% 15% 16% 17% 18% 0 1.000 1.000 1.000 1.000 1.000 1 0.877 0.870 0.862 0.855 0.847 2 0.769 0.756 0.743 0.731 0.718 3 0.675 0.658 0.641 0.624 0.609 4 0.592 0.572 0.552 0.534 0.516 5 0.519 0.497 0.476 0.456 0.437 6 0.456 0.432 0.410 0.390 0.370 7 0.400 0.376 0.354 0.333 0.314 8 0.351 0.327 0.305 0.285 0.266 9 0.308 0.284 0.263 0.243 0.225 10 0.270 0.247 0.227 0.208 0.191 11 0.237 0.215 0.195 0.178 0.162 12 0.208 0.187 0.168 0.152 0.137 13 0.182 0.163 0.145 0.130 0.116 14 0.160 0.141 0.125 0.111 0.099 15 0.140 0.123 0.108 0.095 0.084 16 0.123 0.107 0.093 0.081 0.071 17 0.108 0.093 0.080 0.069 0.060 18 0.095 0.081 0.069 0.059 0.051 19 0.083 0.070 0.060 0.051 0.043 20 0.073 0.061 0.051 0.043 0.037 24 0.043 0.035 0.028 0.023 0.019 25 0.038 0.030 0.024 0.020 0.016 30 0.020 0.015 0.012 0.009 0.007 40 0.005 0.004 0.003 0.002 0.001 50 0.001 0.001 0.001 0.000 0.000 60 0.000 0.000 0.000 0.000 0.000 8% 1.000 0.926 0.857 0.794 0.735 0.681 0.630 0.583 0.540 0.500 0.463 0.429 0.397 0.368 0.340 0.315 0.292 0.270 0.250 0.232 0.215 0.158 0.146 0.099 0.046 0.021 0.010 20% 1.000 0.833 0.694 0.579 0.482 0.402 0.335 0.279 0.233 0.194 0.162 0.135 0.112 0.093 0.078 0.065 0.054 0.045 0.038 0.031 0.026 0.013 0.010 0.004 0.001 0.000 0.000 9% 10% 1.000 1.000 0.917 0.909 0.842 0.826 0.772 0.751 0.708 0.683 0.650 0.621 0.596 0.564 0.547 0.513 0.502 0.467 0.460 0.424 0.422 0.386 0.388 0.350 0.356 0.319 0.326 0.290 0.299 0.263 0.275 0.239 0.252 0.218 0.231 0.198 0.212 0.180 0.194 0.164 0.178 0.149 0.126 0.102 0.116 0.092 0.075 0.057 0.032 0.022 0.013 0.009 0.006 0.003 24% 28% 1.000 1.000 0.806 0.781 0.650 0.610 0.524 0.477 0.423 0.373 0.341 0.291 0.275 0.227 0.222 0.178 0.179 0.139 0.144 0.108 0.116 0.085 0.094 0.066 0.076 0.052 0.061 0.040 0.049 0.032 0.040 0.025 0.032 0.019 0.026 0.015 0.021 0.012 0.017 0.009 0.014 0.007 0.006 0.003 0.005 0.002 0.002 0.001 0.000 0.000 0.000 0.000 0.000 0.000 11% 1.000 0.901 0.812 0.731 0.659 0.593 0.535 0.482 0.434 0.391 0.352 0.317 0.286 0.258 0.232 0.209 0.188 0.170 0.153 0.138 0.124 0.082 0.074 0.044 0.015 0.005 0.002 32% 1.000 0.758 0.574 0.435 0.329 0.250 0.189 0.143 0.108 0.082 0.062 0.047 0.036 0.027 0.021 0.016 0.012 0.009 0.007 0.005 0.004 0.001 0.001 0.000 0.000 0.000 0.000 12% 1.000 0.893 0.797 0.712 0.636 0.567 0.507 0.452 0.404 0.361 0.322 0.287 0.257 0.229 0.205 0.183 0.163 0.146 0.130 0.116 0.104 0.066 0.059 0.033 0.011 0.003 0.001 36% 1.000 0.735 0.541 0.398 0.292 0.215 0.158 0.116 0.085 0.063 0.046 0.034 0.025 0.018 0.014 0.010 0.007 0.005 0.004 0.003 0.002 0.001 0.000 0.000 0.000 0.000 0.000 19% 1.000 0.840 0.706 0.593 0.499 0.419 0.352 0.296 0.249 0.209 0.176 0.148 0.124 0.104 0.088 0.074 0.062 0.052 0.044 0.037 0.031 0.015 0.013 0.005 0.001 0.000 0.000 40% 1.000 0.714 0.510 0.364 0.260 0.186 0.133 0.095 0.068 0.048 0.035 0.025 0.018 0.013 0.009 0.006 0.005 0.003 0.002 0.002 0.001 0.000 0.000 0.000 0.000 0.000 0.000