the suggested answer is:
Need to keep likelihood of changes constant between advantageous and adverse movements as well as between variables. As 5% is the only probability estimate that is constant we will use these NPVs.
Revenue range in NPV = 1200000-200000 = $1 million
Variable cost range in NPV = 1500000-300000 = $1.2 million
Volume of sales range in NPV = 1500000-700000 = $800,000
Ranking Variable cost then Sales revenue per unit then Volume of sales per unit.
----------------------------------------------------------
could you explain why 5% probability estimate is chosen in this case?
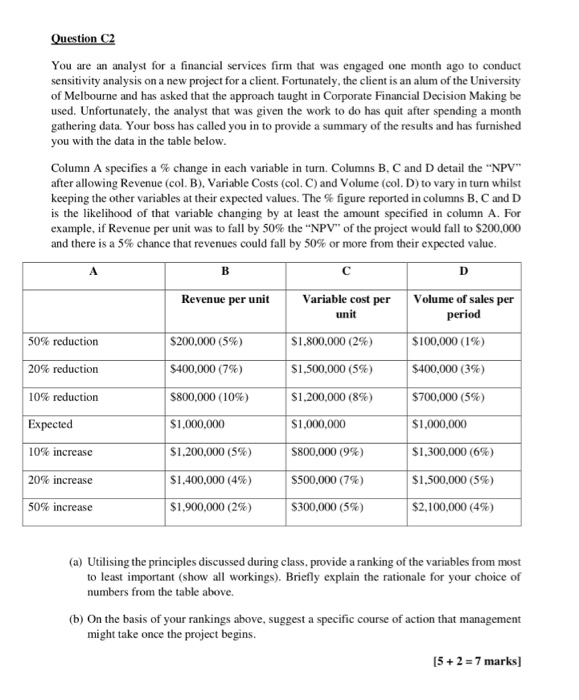
Question C2 You are an analyst for a financial services firm that was engaged one month ago to conduct sensitivity analysis on a new project for a client. Fortunately, the client is an alum of the University of Melbourne and has asked that the approach taught in Corporate Financial Decision Making be used. Unfortunately, the analyst that was given the work to do has quit after spending a month gathering data. Your boss has called you in to provide a summary of the results and has furnished you with the data in the table below. Column A specifies a % change in each variable in turn. Columns B, C and D detail the NPV after allowing Revenue (col. B), Variable Costs (col. C) and Volume (col. D) to vary in turn whilst keeping the other variables at their expected values. The % figure reported in columns B, C and D is the likelihood of that variable changing by at least the amount specified in column A. For example, if Revenue per unit was to fall by 50% the "NPV" of the project would fall to $200,000 and there is a 5% chance that revenues could fall by 50% or more from their expected value. A D Revenue per unit Variable cost per Volume of sales per unit period 50% reduction $200,000 (5%) $1,800,000 (2%) $100,000 (1%) 20% reduction $400,000 (7%) $1,500,000 (5%) $400,000 (3%) 10% reduction $800,000 (10%) $1,200,000 (8%) $700,000 (5%) Expected $1,000,000 $1,000,000 $1,000,000 10% increase $1,200,000 (5%) $800,000 (9%) $1,300,000 (6%) 20% increase $1,400,000 (4%) $500,000 (7%) $1,500,000 (5%) 50% increase $1,900,000 (2%) $300,000 (5%) $2,100,000 (4%) (a) Utilising the principles discussed during class, provide a ranking of the variables from most to least important (show all workings). Briefly explain the rationale for your choice of numbers from the table above. (b) On the basis of your rankings above, suggest a specific course of action that management might take once the project begins. [5+ 2 = 7 marks) Question C2 You are an analyst for a financial services firm that was engaged one month ago to conduct sensitivity analysis on a new project for a client. Fortunately, the client is an alum of the University of Melbourne and has asked that the approach taught in Corporate Financial Decision Making be used. Unfortunately, the analyst that was given the work to do has quit after spending a month gathering data. Your boss has called you in to provide a summary of the results and has furnished you with the data in the table below. Column A specifies a % change in each variable in turn. Columns B, C and D detail the NPV after allowing Revenue (col. B), Variable Costs (col. C) and Volume (col. D) to vary in turn whilst keeping the other variables at their expected values. The % figure reported in columns B, C and D is the likelihood of that variable changing by at least the amount specified in column A. For example, if Revenue per unit was to fall by 50% the "NPV" of the project would fall to $200,000 and there is a 5% chance that revenues could fall by 50% or more from their expected value. A D Revenue per unit Variable cost per Volume of sales per unit period 50% reduction $200,000 (5%) $1,800,000 (2%) $100,000 (1%) 20% reduction $400,000 (7%) $1,500,000 (5%) $400,000 (3%) 10% reduction $800,000 (10%) $1,200,000 (8%) $700,000 (5%) Expected $1,000,000 $1,000,000 $1,000,000 10% increase $1,200,000 (5%) $800,000 (9%) $1,300,000 (6%) 20% increase $1,400,000 (4%) $500,000 (7%) $1,500,000 (5%) 50% increase $1,900,000 (2%) $300,000 (5%) $2,100,000 (4%) (a) Utilising the principles discussed during class, provide a ranking of the variables from most to least important (show all workings). Briefly explain the rationale for your choice of numbers from the table above. (b) On the basis of your rankings above, suggest a specific course of action that management might take once the project begins. [5+ 2 = 7 marks)