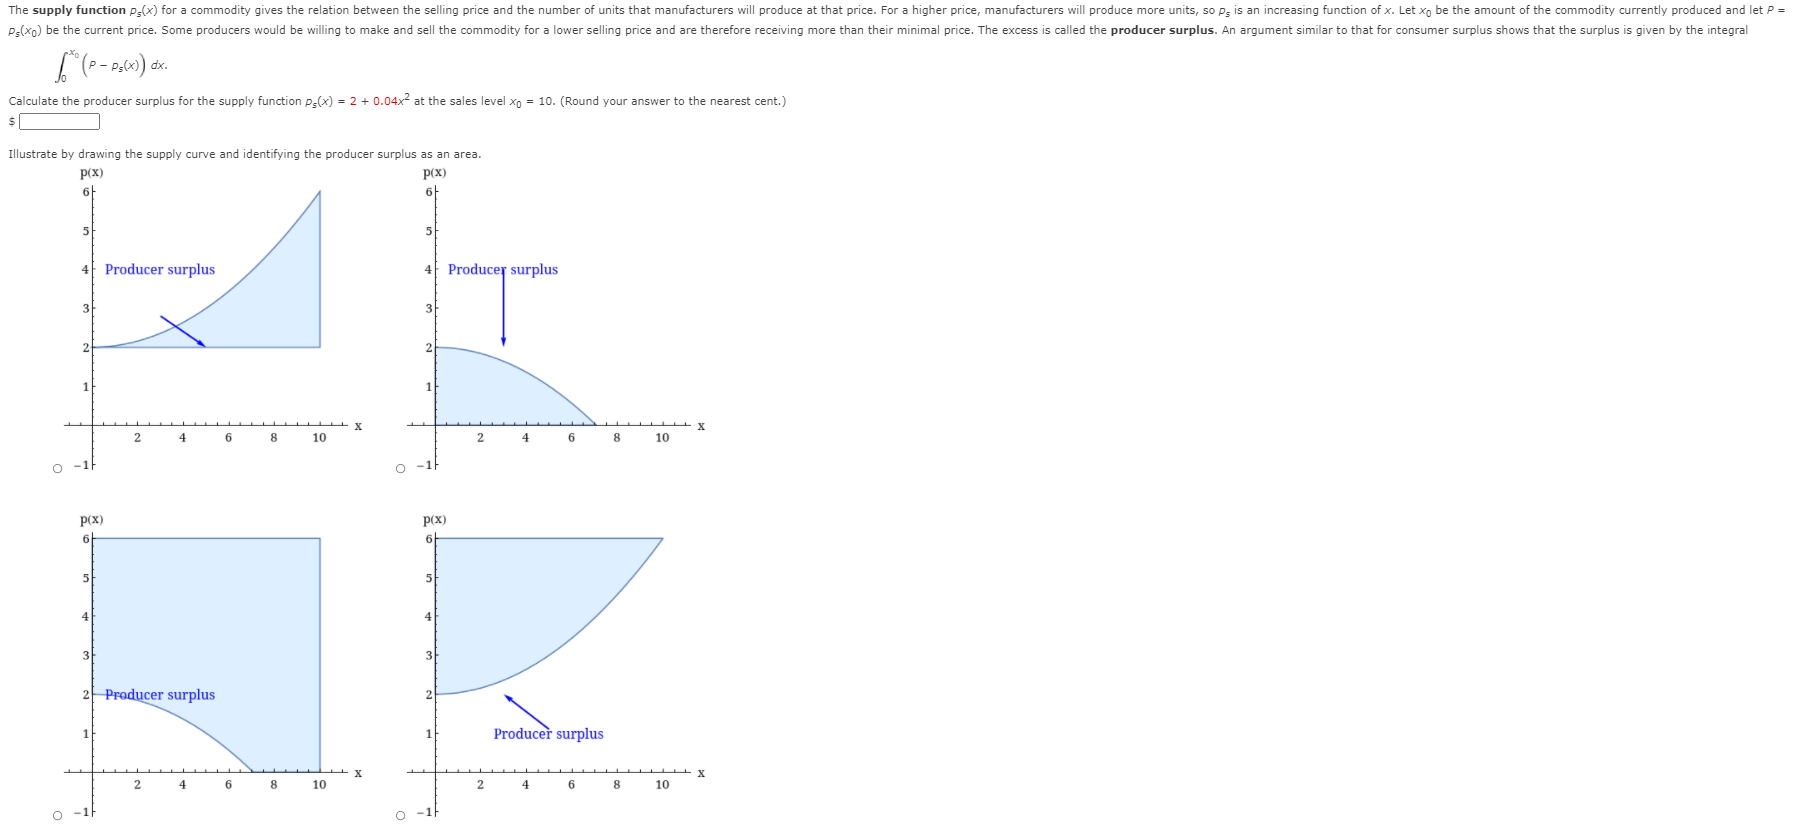
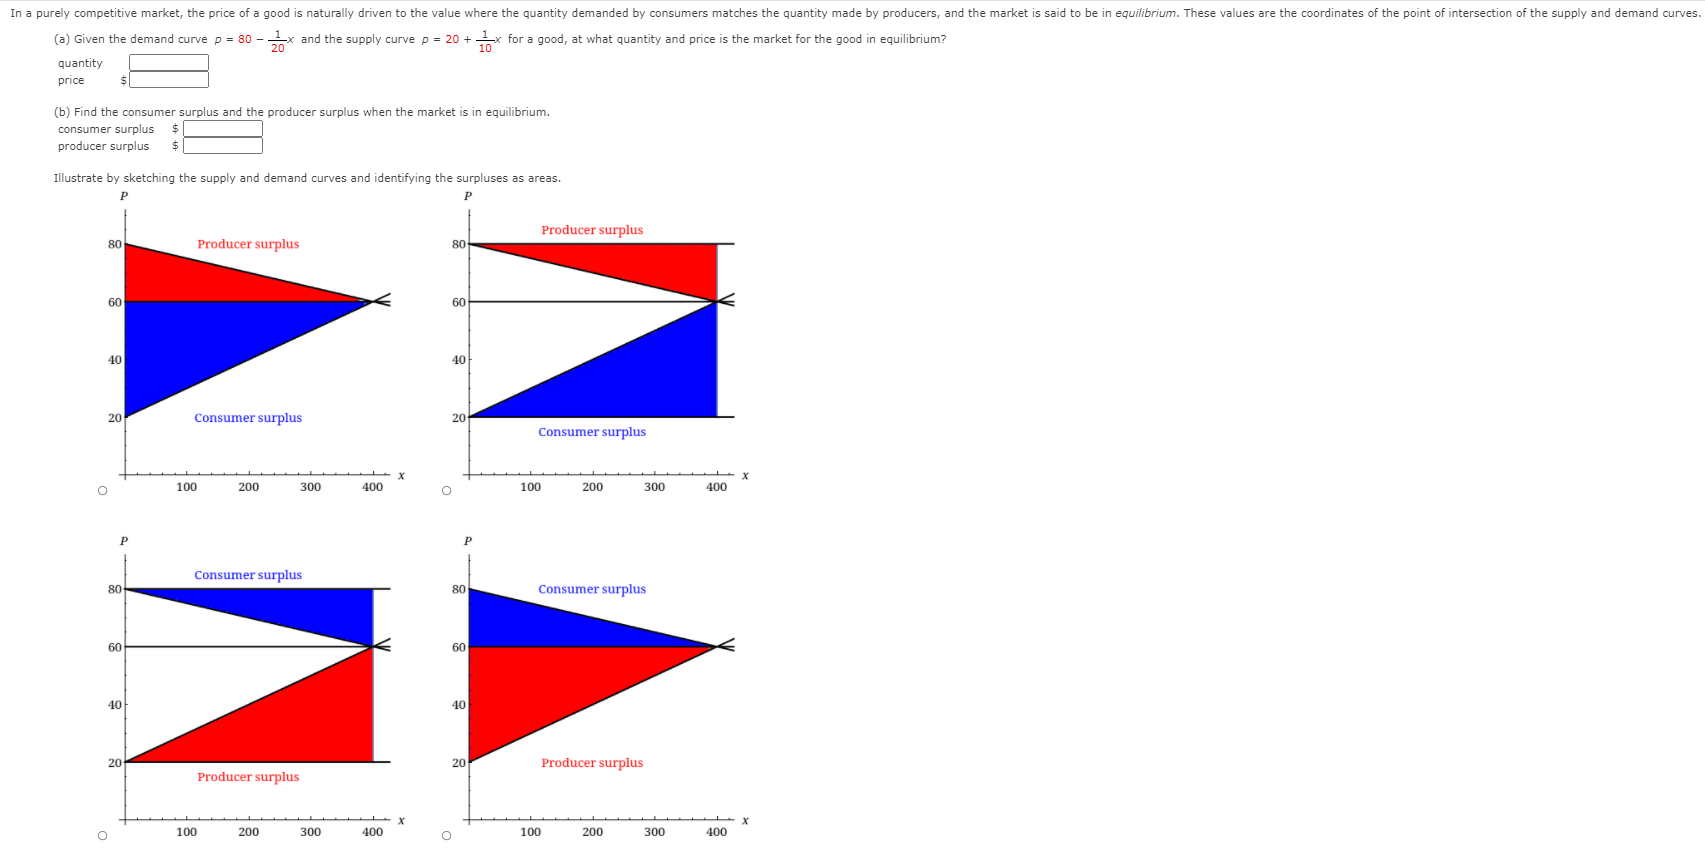
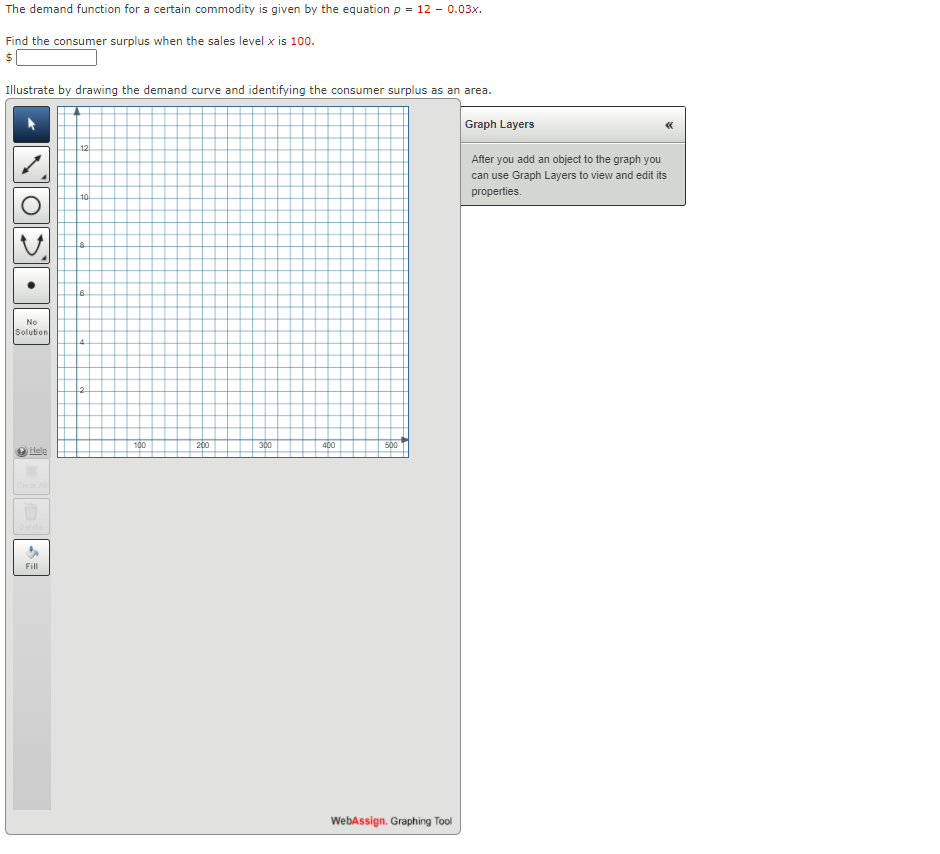
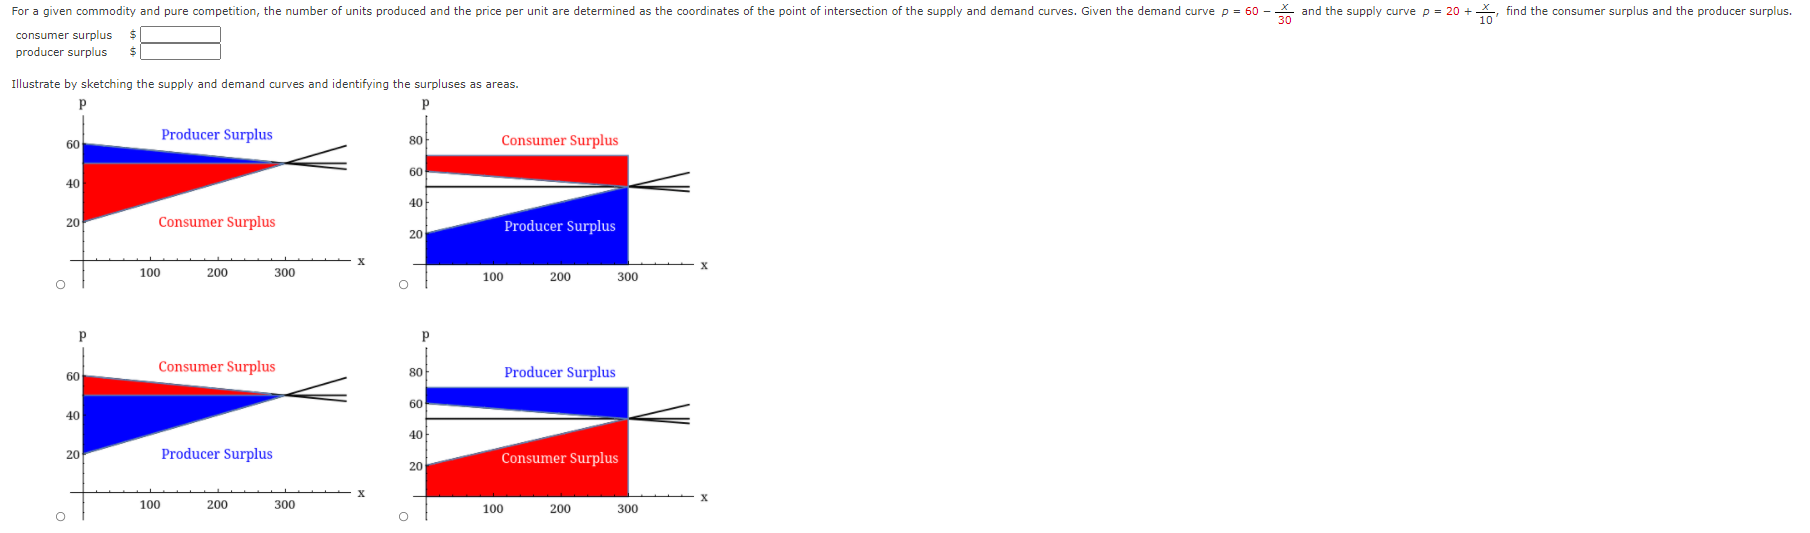
The supply function ps(x) for a commodity gives the relation between the selling price and the number of units that manufacturers will produce at that price. For a higher price, manufacturers will produce more units, so ps is an increasing function of x. Let xo be the amount of the commodity currently produced and let P = Ps(xo) be the current price. Some producers would be willing to make and sell the commodity for a lower selling price and are therefore receiving more than their minimal price. The excess is called the producer surplus. An argument similar to that for consumer surplus shows that the surplus is given by the integral 6. ( P - PS(x) dx. Calculate the producer surplus for the supply function ps(x) = 2 + 0.04x2 at the sales level xo = 10. (Round your answer to the nearest cent.) $ Illustrate by drawing the supply curve and identifying the producer surplus as an area. p(X) P(X) 5 4 Producer surplus 4 Producer surplus 3 2 2 2 6 8 10 2 6 8 10 O O P(X) p(X) 5 5 4 4 3 2 Producer surplus 2 Producer surplus X 2 8 10 2 8 10 O O -IFIn a purely competitive market, the price of a good is naturally driven to the value where the quantity demanded by consumers matches the quantity made by producers, and the market is said to be in equilibrium. These values are the coordinates of the point of intersection of the supply and demand curves. (a) Given the demand curve p = 80 - -x and the supply curve p = 20 + - x for a good, at what quantity and price is the market for the good in equilibrium? quantity price (b) Find the consumer surplus and the producer surplus when the market is in equilibrium. consumer surplus $ producer surplus Illustrate by sketching the supply and demand curves and identifying the surpluses as areas. Producer surplus 80 Producer surplus 80 60 60 10 20 Consumer surplus 20 Consumer surplus - X O 100 200 300 400 100 200 300 400 P Consumer surplus 80 80 Consumer surplus 60 60 40 40 20 20 Producer surplus Producer surplus X O 100 200 300 400 O 100 200 300 400111e demand function for a certain commodity is given by the equation p = 12 0.03x. Find the consumer surplus when the sales level x is 100. $|:| Illustrate by drawing the demand mrve and identifying the consumer surplus as an area. For a given commodity and pure competition, the number of units produced and the price per unit are determined as the coordinates of the point of intersection of the supply and demand curves. Given the demand curve p = 60 - - and the supply curve p = 20 + -, find the consumer surplus and the producer surplus. consumer surplus producer surplus Illustrate by sketching the supply and demand curves and identifying the surpluses as areas. 60 Producer Surplus 30 Consumer Surplus 40 40 20 Consumer Surplus 20 Producer Surplus 100 200 300 O 100 200 300 Consumer Surplus 60 Producer Surplus 40 40 20 Producer Surplus 20 Consumer Surplus 100 200 300 100 200 300