

Question
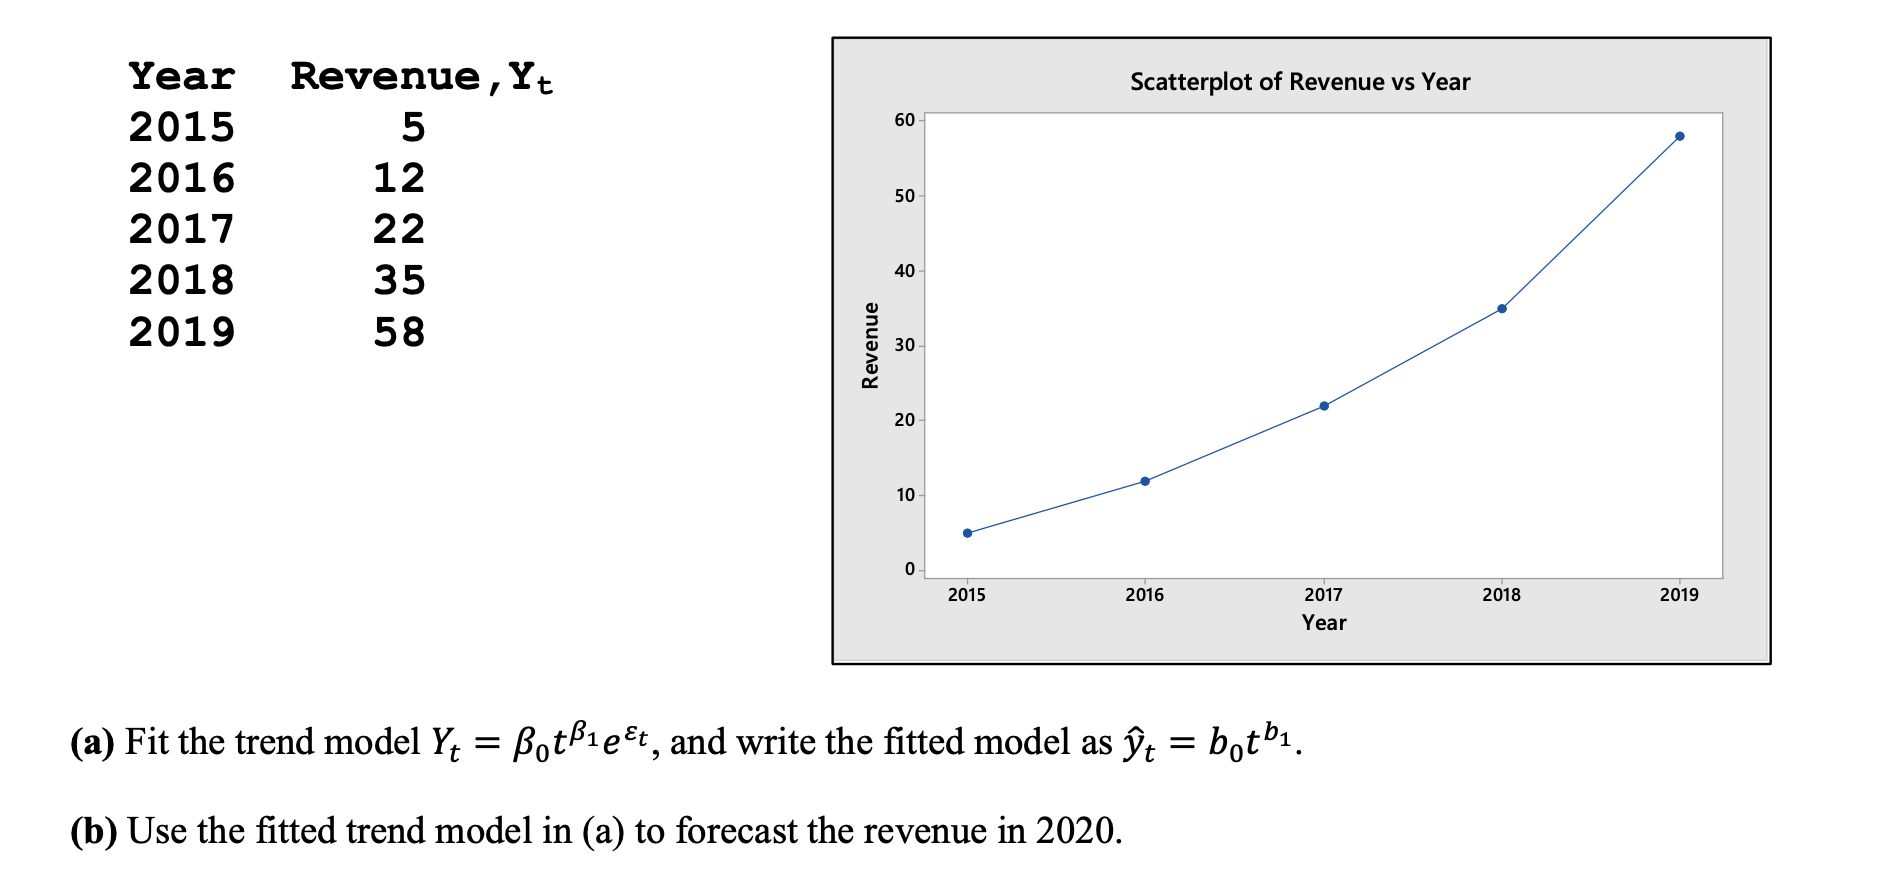
The table and graph below show the annual revenue (in millions of dollars) for a cyber security company from 2015 to 2019. Year Revenue ,
The table and graph below show the annual revenue (in millions of dollars) for a cyber security
company from 2015 to 2019.
Step by Step Solution
There are 3 Steps involved in it
Step: 1

Get Instant Access to Expert-Tailored Solutions
See step-by-step solutions with expert insights and AI powered tools for academic success
Step: 2

Step: 3
Ace Your Homework with AI
Get the answers you need in no time with our AI-driven, step-by-step assistance
Get Started
Finite Mathematics and Its Applications
Authors: Larry J. Goldstein, David I. Schneider, Martha J. Siegel, Steven Hair
12th edition
978-0134768588, 9780134437767, 134768582, 134437764, 978-0134768632