

Question
The table and scatter plot show the number of hours worked, x , and the amount of money spent on entertainment, y, by each of
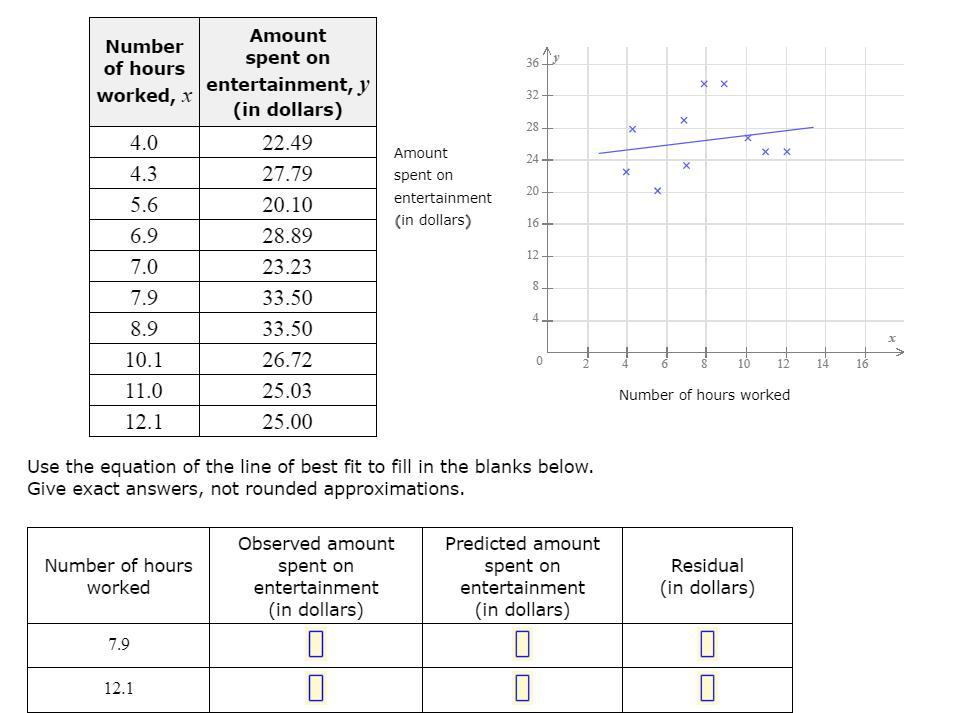
The table and scatter plot show the number of hours worked, x , and the amount of money spent on entertainment, y, by each of 10 students. The equation of the line of best fit is y=0.3x+24.00 Use the equation of the line of best fit to fill in the blanks below. Give exact answers, not rounded approximations.
Step by Step Solution
There are 3 Steps involved in it
Step: 1

Get Instant Access to Expert-Tailored Solutions
See step-by-step solutions with expert insights and AI powered tools for academic success
Step: 2

Step: 3
Ace Your Homework with AI
Get the answers you need in no time with our AI-driven, step-by-step assistance
Get Started
Linear Algebra and Its Applications
Authors: Gilbert Strang
4th edition
30105678, 30105676, 978-0030105678