

Answered step by step
Verified Expert Solution
Question
1 Approved Answer
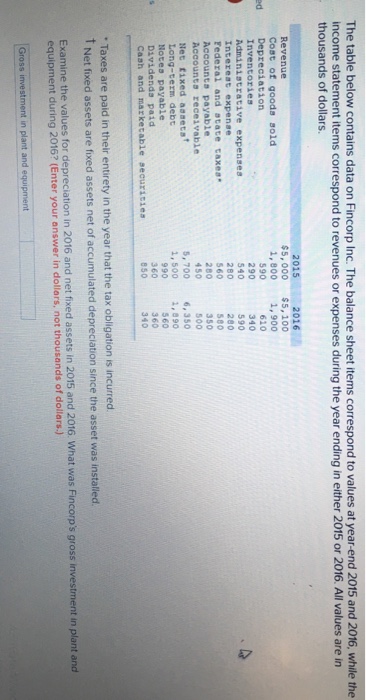
The table below contains data on Fincorp Inc. The balance sheet items correspond to values at year-end 2015 and 2016, while the income statement items
Step by Step Solution
There are 3 Steps involved in it
Step: 1

Get Instant Access to Expert-Tailored Solutions
See step-by-step solutions with expert insights and AI powered tools for academic success
Step: 2

Step: 3
Ace Your Homework with AI
Get the answers you need in no time with our AI-driven, step-by-step assistance
Get Started
Globalization Gating And Risk Finance
Authors: Unurjargal Nyambuu, Charles S. Tapiero
1st Edition
1119252652, 978-1119252658