

Answered step by step
Verified Expert Solution
Question
1 Approved Answer
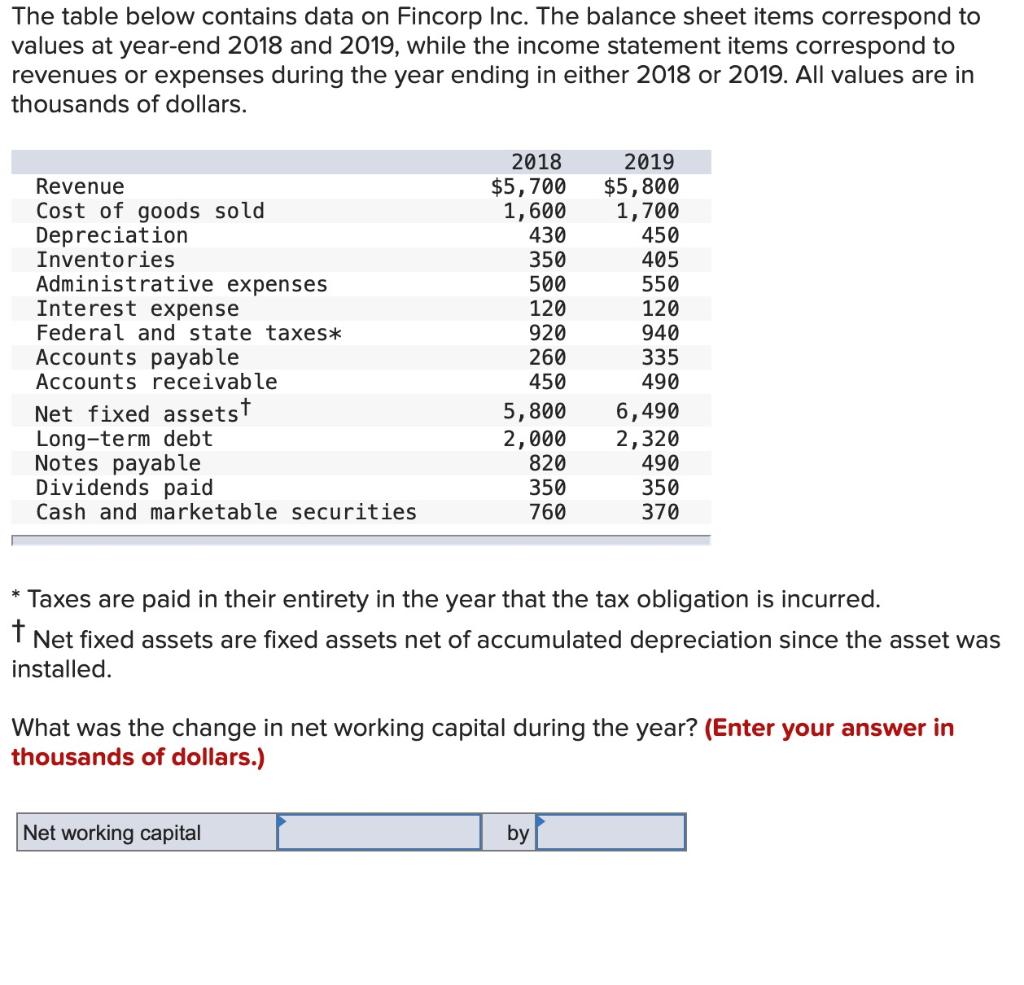
The table below contains data on Fincorp Inc. The balance sheet items correspond to values at year-end 2018 and 2019, while the income statement items
Step by Step Solution
There are 3 Steps involved in it
Step: 1

Get Instant Access to Expert-Tailored Solutions
See step-by-step solutions with expert insights and AI powered tools for academic success
Step: 2

Step: 3
Ace Your Homework with AI
Get the answers you need in no time with our AI-driven, step-by-step assistance
Get Started
Finance And Democracy Towards A Sustainable Financial System
Authors: Alessandro Vercelli
1st Edition
3030279111, 978-3030279110