Answered step by step
Verified Expert Solution
Question
1 Approved Answer
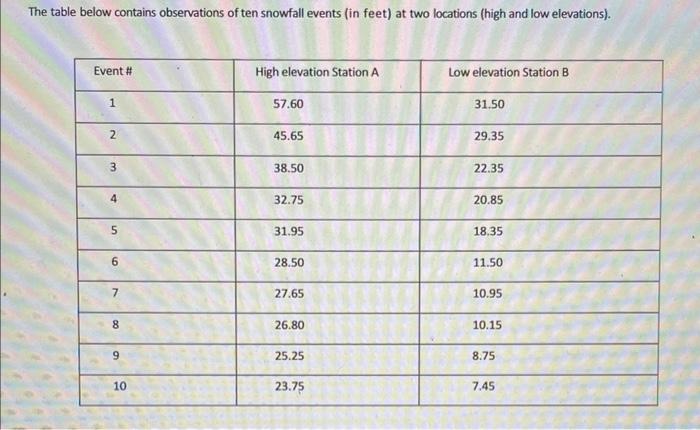
The table below contains observations of ten snowfall events (in feet) at two locations (high and low elevations). Event # High elevation Station A


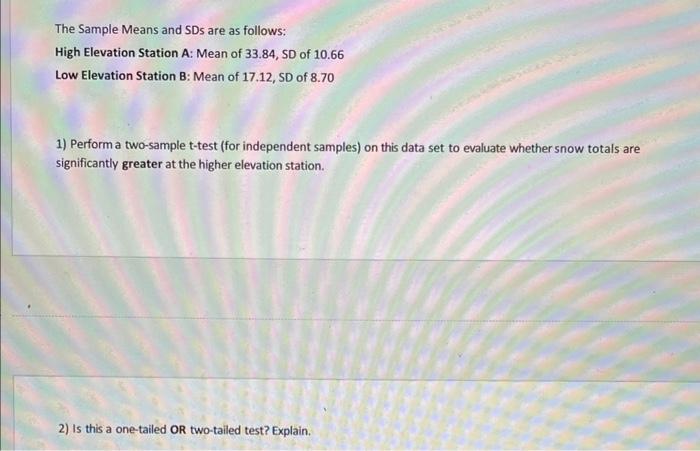
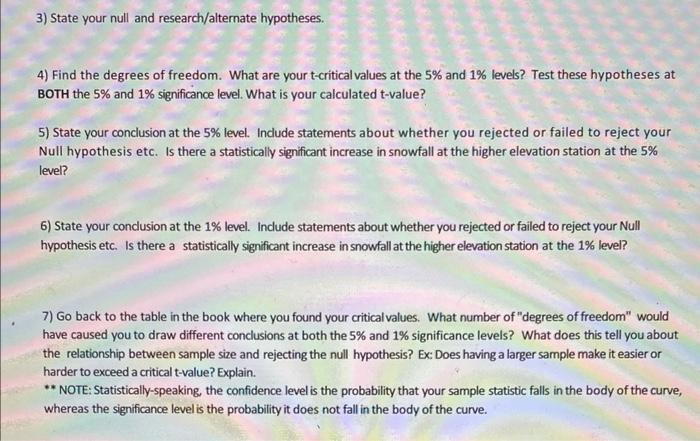
The table below contains observations of ten snowfall events (in feet) at two locations (high and low elevations). Event # High elevation Station A Low elevation Station B 1 57.60 31.50 2 45.65 29.35 3 38.50 22.35 4 32.75 20.85 5 31.95 18.35 9 28.50 11.50 7 27.65 10.95 8 26.80 10.15 6 25.25 8.75 10 23.75 7.45 The Sample Means and SDS are as follows: High Elevation Station A: Mean of 33.84, SD of 10.66 Low Elevation Station B: Mean of 17.12, SD of 8.70 1) Perform a two-sample t-test (for independent samples) on this data set to evaluate whether snow totals are significantly greater at the higher elevation station. 2) Is this a one-tailed OR two-tailed test? Explain. 3) State your null and research/alternate hypotheses. 4) Find the degrees of freedom. What are your t-critical values at the 5% and 1% levels? Test these hypotheses at BOTH the 5% and 1% significance level. What is your calculated t-value? 5) State your conclusion at the 5% level. Include statements about whether you rejected or failed to reject your Null hypothesis etc. Is there a statistically significant increase in snowfall at the higher elevation station at the 5% level? 6) State your conclusion at the 1% level. Include statements about whether you rejected or failed to reject your Null hypothesis etc. Is there a statistically significant increase in snowfall at the higher elevation station at the 1% level? 7) Go back to the table in the book where you found your critical values. What number of "degrees of freedom" would have caused you to draw different conclusions at both the 5% and 1% significance levels? What does this tell you about the relationship between sample size and rejecting the null hypothesis? Ex: Does having a larger sample make it easier or harder to exceed a critical t-value? Explain. **NOTE: Statistically-speaking, the confidence level is the probability that your sample statistic falls in the body of the curve, whereas the significance level is the probability it does not fall in the body of the curve. 8) Using the above definitions, in which test [#5 at the 5% level OR #6 at the 1% level] would you have more statistical confidence? Why? (Hint-the answer has nothing to do with the actual numbers you calculated-it is a question about the relationship between statistical significance and confidence. 9) If the significance level was 0.01, what would be your confidence level? (Recall that the two together equal the total area under the normal curve.)
Step by Step Solution
There are 3 Steps involved in it
Step: 1

Get Instant Access to Expert-Tailored Solutions
See step-by-step solutions with expert insights and AI powered tools for academic success
Step: 2

Step: 3

Ace Your Homework with AI
Get the answers you need in no time with our AI-driven, step-by-step assistance
Get Started


