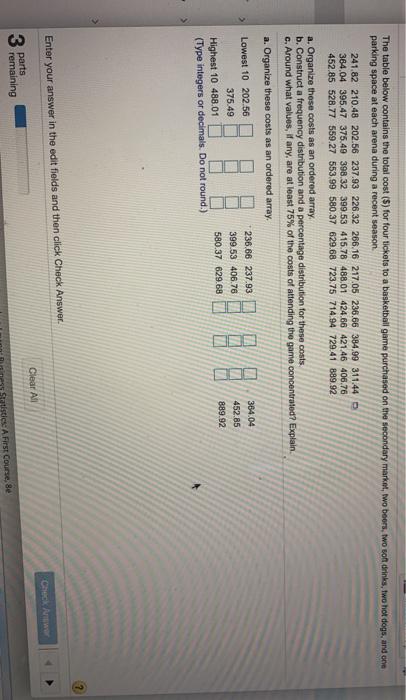
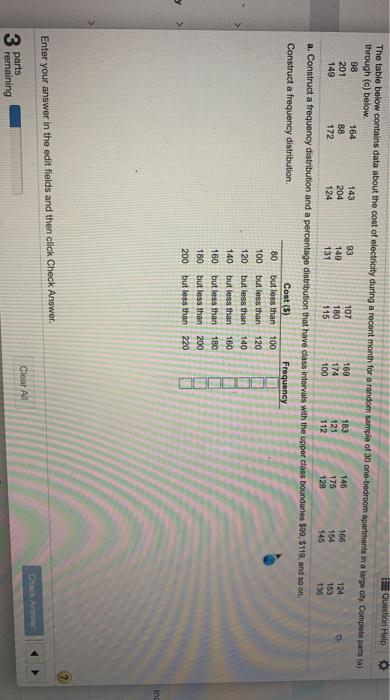
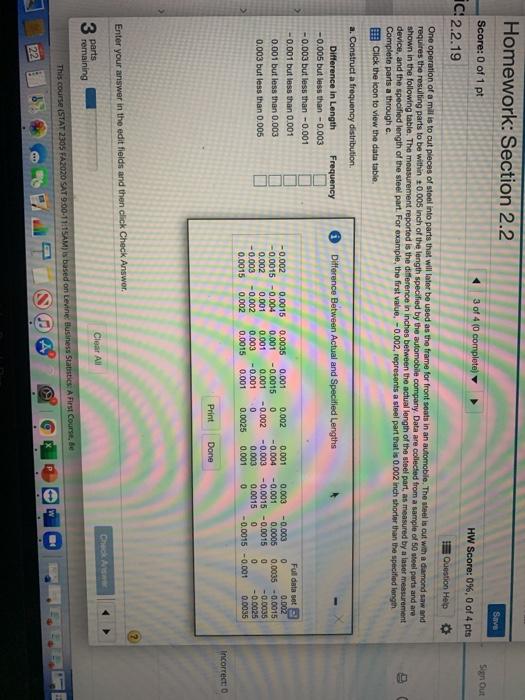
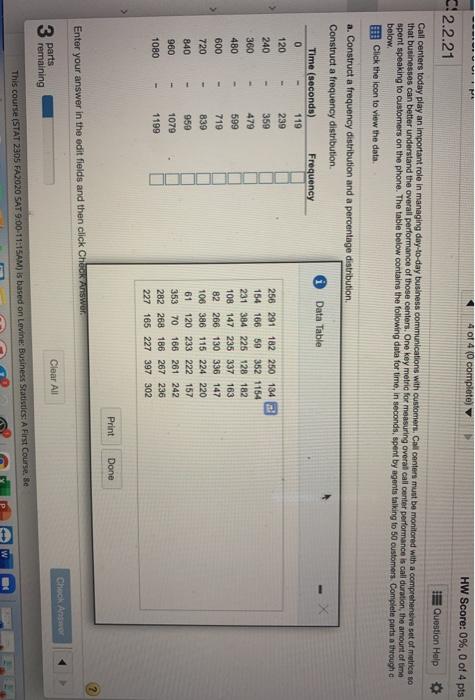
The table below contains the total cost ($) for four tickets to a basketball game purchased on the secondary market, two beers, two to drinks, two hot dogs, and one parking space at each arena during a recent season. 241.82 210.48 202.56 237.93 226.32 266.16 217.05 236.66 384.99 311.44 364.04 395.47 375.49 398.32 399.53 415.78 488,01 424.66 421.46 406.76 452.85 528.77 559.27 553,99 580.37 629.68 723.75 714 94 729.41 889.92 a. Organize these costs as an ordered array b. Construct a frequency distribution and a percentage distribution for these costs C. Around what values, if any, are at least 75% of the costs of attending the game concentrated? Explain. a. Organize these costs as an ordered array, Lowest 10 202.56 375.49 Highest 10 488.01 (Type integers or decimals. Do not round.) 236.66 237.93 399.53 406.76 580.37 629.68 888 384.04 452 85 889.92 Enter your answer in the edit fields and then click Check Answer. Check Clear Al 3 parts remaining Satistics A First Course, 8e 180 124 The table below contains data about the cost of electricity during a recent month for a random sample of 30 one-bedroom apartments in a large city. Complete parts a Question Help through (c) below. 98 164 143 93 107 201 169 88 183 145 204 149 168 124 149 172 174 121 131 175 154 115 153 100 112 120 145 136 a. Construct a frequency distribution and a percentage distribution that have class intervals with the upper class boundaries $99,5119, and so on. Construct a frequency distribution Frequency 80 but less than 100 100 but less than 120 120 but less than 140 140 but less than 160 160 but less than 180 but less than 200 but less than 220 Cost (5) 180 200 ing Enter your answer in the edit fields and then click Check Answer. Clear All 3 parts remaining Homework: Section 2.2 SA Score: 0 of 1 pt Sign Out 3 of 4 (0 completa) HW Score: 0%, 0 of 4 pts C.2.2.19 Question Help One operation of a mill is to cut pieces of stool into parts that will later be used as the frame for front seats in an automobile. The stoel is out with a diamond saw and requires the resulting parts to be within +0.005 inch of the length specified by the automobile company. Data are collected from a sample of 50 steel parts and are shown in the following table. The measurement reported is the difference in inches between the actual length of the stoel part, as measured by a laser measurement device, and the specified length of the steel part. For example, the first value. -0.002, represents a steel part that is 0.002 inch shorter than the specified length Complete parts a through c. B! Click the icon to view the data table e Difference Between Actual and Specitled Lengths a. Construct a frequency distribution Difference in Length Frequency -0.005 but less than -0.003 -0.003 but less than -0.001 0.001 but less than 0.001 0.001 but less than 0.003 0.003 but less than 0.005 -0.002 0.0015 -0.0015-0.004 0.002 0.001 -0.003 -0.002 0.0015 0.002 0.0035 0.001 0.002 0.001 -0.0015 0 0.001 0.001 -0.002 0.003 -0.001 0 0.0015 0.001 0.0025 Fuldataset 0.001 0.003 -0.003 0 0.002 -0.004 -0.001 0.0005 0.0035 -0.0015 -0.003 -0.0015 -0.0015 0 -0.0035 0.003 0.0015 0 0 -0.0025 0.001 0 -0.0015 -0.001 0.0035 Incorrect: Print Done Enter your answer in the edit fields and then click Check Answer Clear All 3 parts remaining This course (STAT 2305 FA2020 SAT 9.00-11:15AM) is based on Levine Business Statistics: A First Course.be A 9 22 4 of 4 (0 complete HW Score: 0%, 0 of 4 pts 2.2.2.21 Question Help Call centers today play an important role in managing day-to-day business communications with customers. Call centers must be monitored with a comprehensive set of metrice so that businesses can better understand the overall performance of those centers. One key metric for measuring overall call center performance is call duration, the amount of time spent speaking to customers on the phone. The table below contains the following data for time, in seconds, spent by agents talking to 50 customers. Complete parts a through a below Click the icon to view the data a. Construct a frequency distribution and a percentage distribution Construct a frequency distribution Time (seconds) Data Table Frequency 0 119 120 239 240 359 256 291 182 250 134 154 166 59 352 1154 360 231 384 225 128 182 480 599 108 147 235 37 163 600 719 82 266 130 336 147 720 839 106 386 115 224 220 840 950 61 120 233 222 157 1079 960 70 353 166 261 242 1080 1199 282 268 186 267 236 227 165 227 397 302 479 Print Done Enter your answer in the edit fields and then click ChORATSWOT Check Anno Clear All 3 parts remaining This course (STAT 2305 FA2020 SAT 9.00-11:15AM) is based on Levine: Business Statistics: A First Course. Be w The table below contains the total cost ($) for four tickets to a basketball game purchased on the secondary market, two beers, two to drinks, two hot dogs, and one parking space at each arena during a recent season. 241.82 210.48 202.56 237.93 226.32 266.16 217.05 236.66 384.99 311.44 364.04 395.47 375.49 398.32 399.53 415.78 488,01 424.66 421.46 406.76 452.85 528.77 559.27 553,99 580.37 629.68 723.75 714 94 729.41 889.92 a. Organize these costs as an ordered array b. Construct a frequency distribution and a percentage distribution for these costs C. Around what values, if any, are at least 75% of the costs of attending the game concentrated? Explain. a. Organize these costs as an ordered array, Lowest 10 202.56 375.49 Highest 10 488.01 (Type integers or decimals. Do not round.) 236.66 237.93 399.53 406.76 580.37 629.68 888 384.04 452 85 889.92 Enter your answer in the edit fields and then click Check Answer. Check Clear Al 3 parts remaining Satistics A First Course, 8e 180 124 The table below contains data about the cost of electricity during a recent month for a random sample of 30 one-bedroom apartments in a large city. Complete parts a Question Help through (c) below. 98 164 143 93 107 201 169 88 183 145 204 149 168 124 149 172 174 121 131 175 154 115 153 100 112 120 145 136 a. Construct a frequency distribution and a percentage distribution that have class intervals with the upper class boundaries $99,5119, and so on. Construct a frequency distribution Frequency 80 but less than 100 100 but less than 120 120 but less than 140 140 but less than 160 160 but less than 180 but less than 200 but less than 220 Cost (5) 180 200 ing Enter your answer in the edit fields and then click Check Answer. Clear All 3 parts remaining Homework: Section 2.2 SA Score: 0 of 1 pt Sign Out 3 of 4 (0 completa) HW Score: 0%, 0 of 4 pts C.2.2.19 Question Help One operation of a mill is to cut pieces of stool into parts that will later be used as the frame for front seats in an automobile. The stoel is out with a diamond saw and requires the resulting parts to be within +0.005 inch of the length specified by the automobile company. Data are collected from a sample of 50 steel parts and are shown in the following table. The measurement reported is the difference in inches between the actual length of the stoel part, as measured by a laser measurement device, and the specified length of the steel part. For example, the first value. -0.002, represents a steel part that is 0.002 inch shorter than the specified length Complete parts a through c. B! Click the icon to view the data table e Difference Between Actual and Specitled Lengths a. Construct a frequency distribution Difference in Length Frequency -0.005 but less than -0.003 -0.003 but less than -0.001 0.001 but less than 0.001 0.001 but less than 0.003 0.003 but less than 0.005 -0.002 0.0015 -0.0015-0.004 0.002 0.001 -0.003 -0.002 0.0015 0.002 0.0035 0.001 0.002 0.001 -0.0015 0 0.001 0.001 -0.002 0.003 -0.001 0 0.0015 0.001 0.0025 Fuldataset 0.001 0.003 -0.003 0 0.002 -0.004 -0.001 0.0005 0.0035 -0.0015 -0.003 -0.0015 -0.0015 0 -0.0035 0.003 0.0015 0 0 -0.0025 0.001 0 -0.0015 -0.001 0.0035 Incorrect: Print Done Enter your answer in the edit fields and then click Check Answer Clear All 3 parts remaining This course (STAT 2305 FA2020 SAT 9.00-11:15AM) is based on Levine Business Statistics: A First Course.be A 9 22 4 of 4 (0 complete HW Score: 0%, 0 of 4 pts 2.2.2.21 Question Help Call centers today play an important role in managing day-to-day business communications with customers. Call centers must be monitored with a comprehensive set of metrice so that businesses can better understand the overall performance of those centers. One key metric for measuring overall call center performance is call duration, the amount of time spent speaking to customers on the phone. The table below contains the following data for time, in seconds, spent by agents talking to 50 customers. Complete parts a through a below Click the icon to view the data a. Construct a frequency distribution and a percentage distribution Construct a frequency distribution Time (seconds) Data Table Frequency 0 119 120 239 240 359 256 291 182 250 134 154 166 59 352 1154 360 231 384 225 128 182 480 599 108 147 235 37 163 600 719 82 266 130 336 147 720 839 106 386 115 224 220 840 950 61 120 233 222 157 1079 960 70 353 166 261 242 1080 1199 282 268 186 267 236 227 165 227 397 302 479 Print Done Enter your answer in the edit fields and then click ChORATSWOT Check Anno Clear All 3 parts remaining This course (STAT 2305 FA2020 SAT 9.00-11:15AM) is based on Levine: Business Statistics: A First Course. Be w
