Question
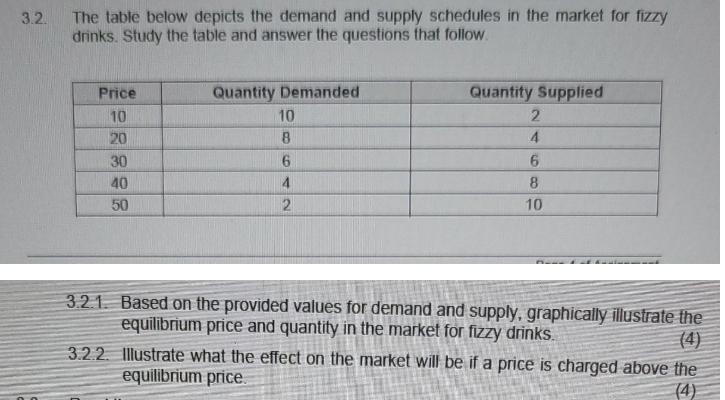
The table below depicts the demand and supply schedules in the market for fizzy drinks. Study the table and answer the questions that follow.

The table below depicts the demand and supply schedules in the market for fizzy drinks. Study the table and answer the questions that follow. Price 10 20 30 40 50 Quantity Demanded 10 8 6 4 2 Quantity Supplied 2 4 6 8 10 3.2.1 Based on the provided values for demand and supply, graphically illustrate the equilibrium price and quantity in the market for fizzy drinks. 3.2.2. Illustrate what the effect on the market will be if a price is charged above the equilibrium price.
Step by Step Solution
3.53 Rating (163 Votes )
There are 3 Steps involved in it
Step: 1
The detailed ...
Get Instant Access to Expert-Tailored Solutions
See step-by-step solutions with expert insights and AI powered tools for academic success
Step: 2

Step: 3

Ace Your Homework with AI
Get the answers you need in no time with our AI-driven, step-by-step assistance
Get StartedRecommended Textbook for
Introduction to Operations Research
Authors: Frederick S. Hillier, Gerald J. Lieberman
10th edition
978-0072535105, 72535105, 978-1259162985
Students also viewed these Accounting questions
Question
Answered: 1 week ago
Question
Answered: 1 week ago
Question
Answered: 1 week ago
Question
Answered: 1 week ago
Question
Answered: 1 week ago
Question
Answered: 1 week ago
Question
Answered: 1 week ago
Question
Answered: 1 week ago
Question
Answered: 1 week ago
Question
Answered: 1 week ago
Question
Answered: 1 week ago
Question
Answered: 1 week ago
Question
Answered: 1 week ago
Question
Answered: 1 week ago
Question
Answered: 1 week ago
Question
Answered: 1 week ago
Question
Answered: 1 week ago
Question
Answered: 1 week ago
Question
Answered: 1 week ago
Question
Answered: 1 week ago
Question
Answered: 1 week ago
Question
Answered: 1 week ago
Question
Answered: 1 week ago
View Answer in SolutionInn App


