Answered step by step
Verified Expert Solution
Question
1 Approved Answer
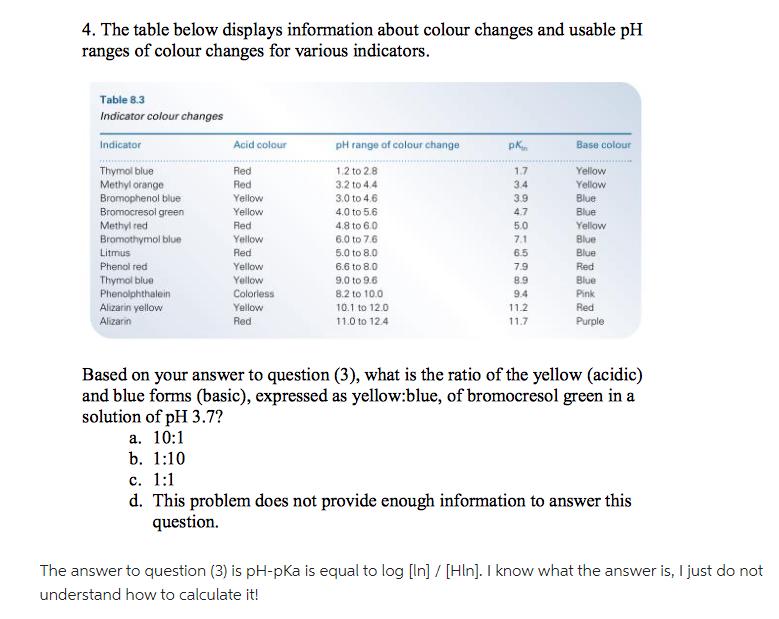
The table below displays information about colour changes and usable pH ranges of colour changes for various indicators. Table 8.3 Indicator colour changes Indicator

The table below displays information about colour changes and usable pH ranges of colour changes for various indicators. Table 8.3 Indicator colour changes Indicator Thymol blue Methyl orange Bromophenol blue Bromocresol green Methyl red Bromothymol blue Litmus Phenol red Thymol blue Phenolphthalein Alizarin yellow Alizarin Acid colour Red Red Yellow Yellow Red Yellow Red Yellow Yellow Colorless Yellow Red pH range of colour change 1,2 to 2.8 3.2 to 4.4 3.0 to 4.6 4.0 to 5.6 4.8 to 6.0 6.0 to 7.6 5.0 to 8.0 6.6 to 8.0 9.0 to 9.6 8.2 to 10.0 10.1 to 12.0 11.0 to 12.4 pk 1.7 3.4 3.9 4.7 5.0 7.1 76 6.5 7.9 8.9 9.4 11.2 11.7 Base colour Yellow Yellow Blue Blue Yellow Blue Blue Red Blue Pink Red Purple Based on your answer to question (3), what is the ratio of the yellow (acidic) and blue forms (basic), expressed as yellow:blue, of bromocresol green in a solution of pH 3.7? a. 10:1 b. 1:10 c. 1:1 d. This problem does not provide enough information to answer this question. The answer to question (3) is pH-pKa is equal to log [In] / [Hin]. I know what the answer is, I just do not understand how to calculate it!
Step by Step Solution
There are 3 Steps involved in it
Step: 1
The detailed ...
Get Instant Access to Expert-Tailored Solutions
See step-by-step solutions with expert insights and AI powered tools for academic success
Step: 2

Step: 3

Ace Your Homework with AI
Get the answers you need in no time with our AI-driven, step-by-step assistance
Get Started


