

Answered step by step
Verified Expert Solution
Question
1 Approved Answer
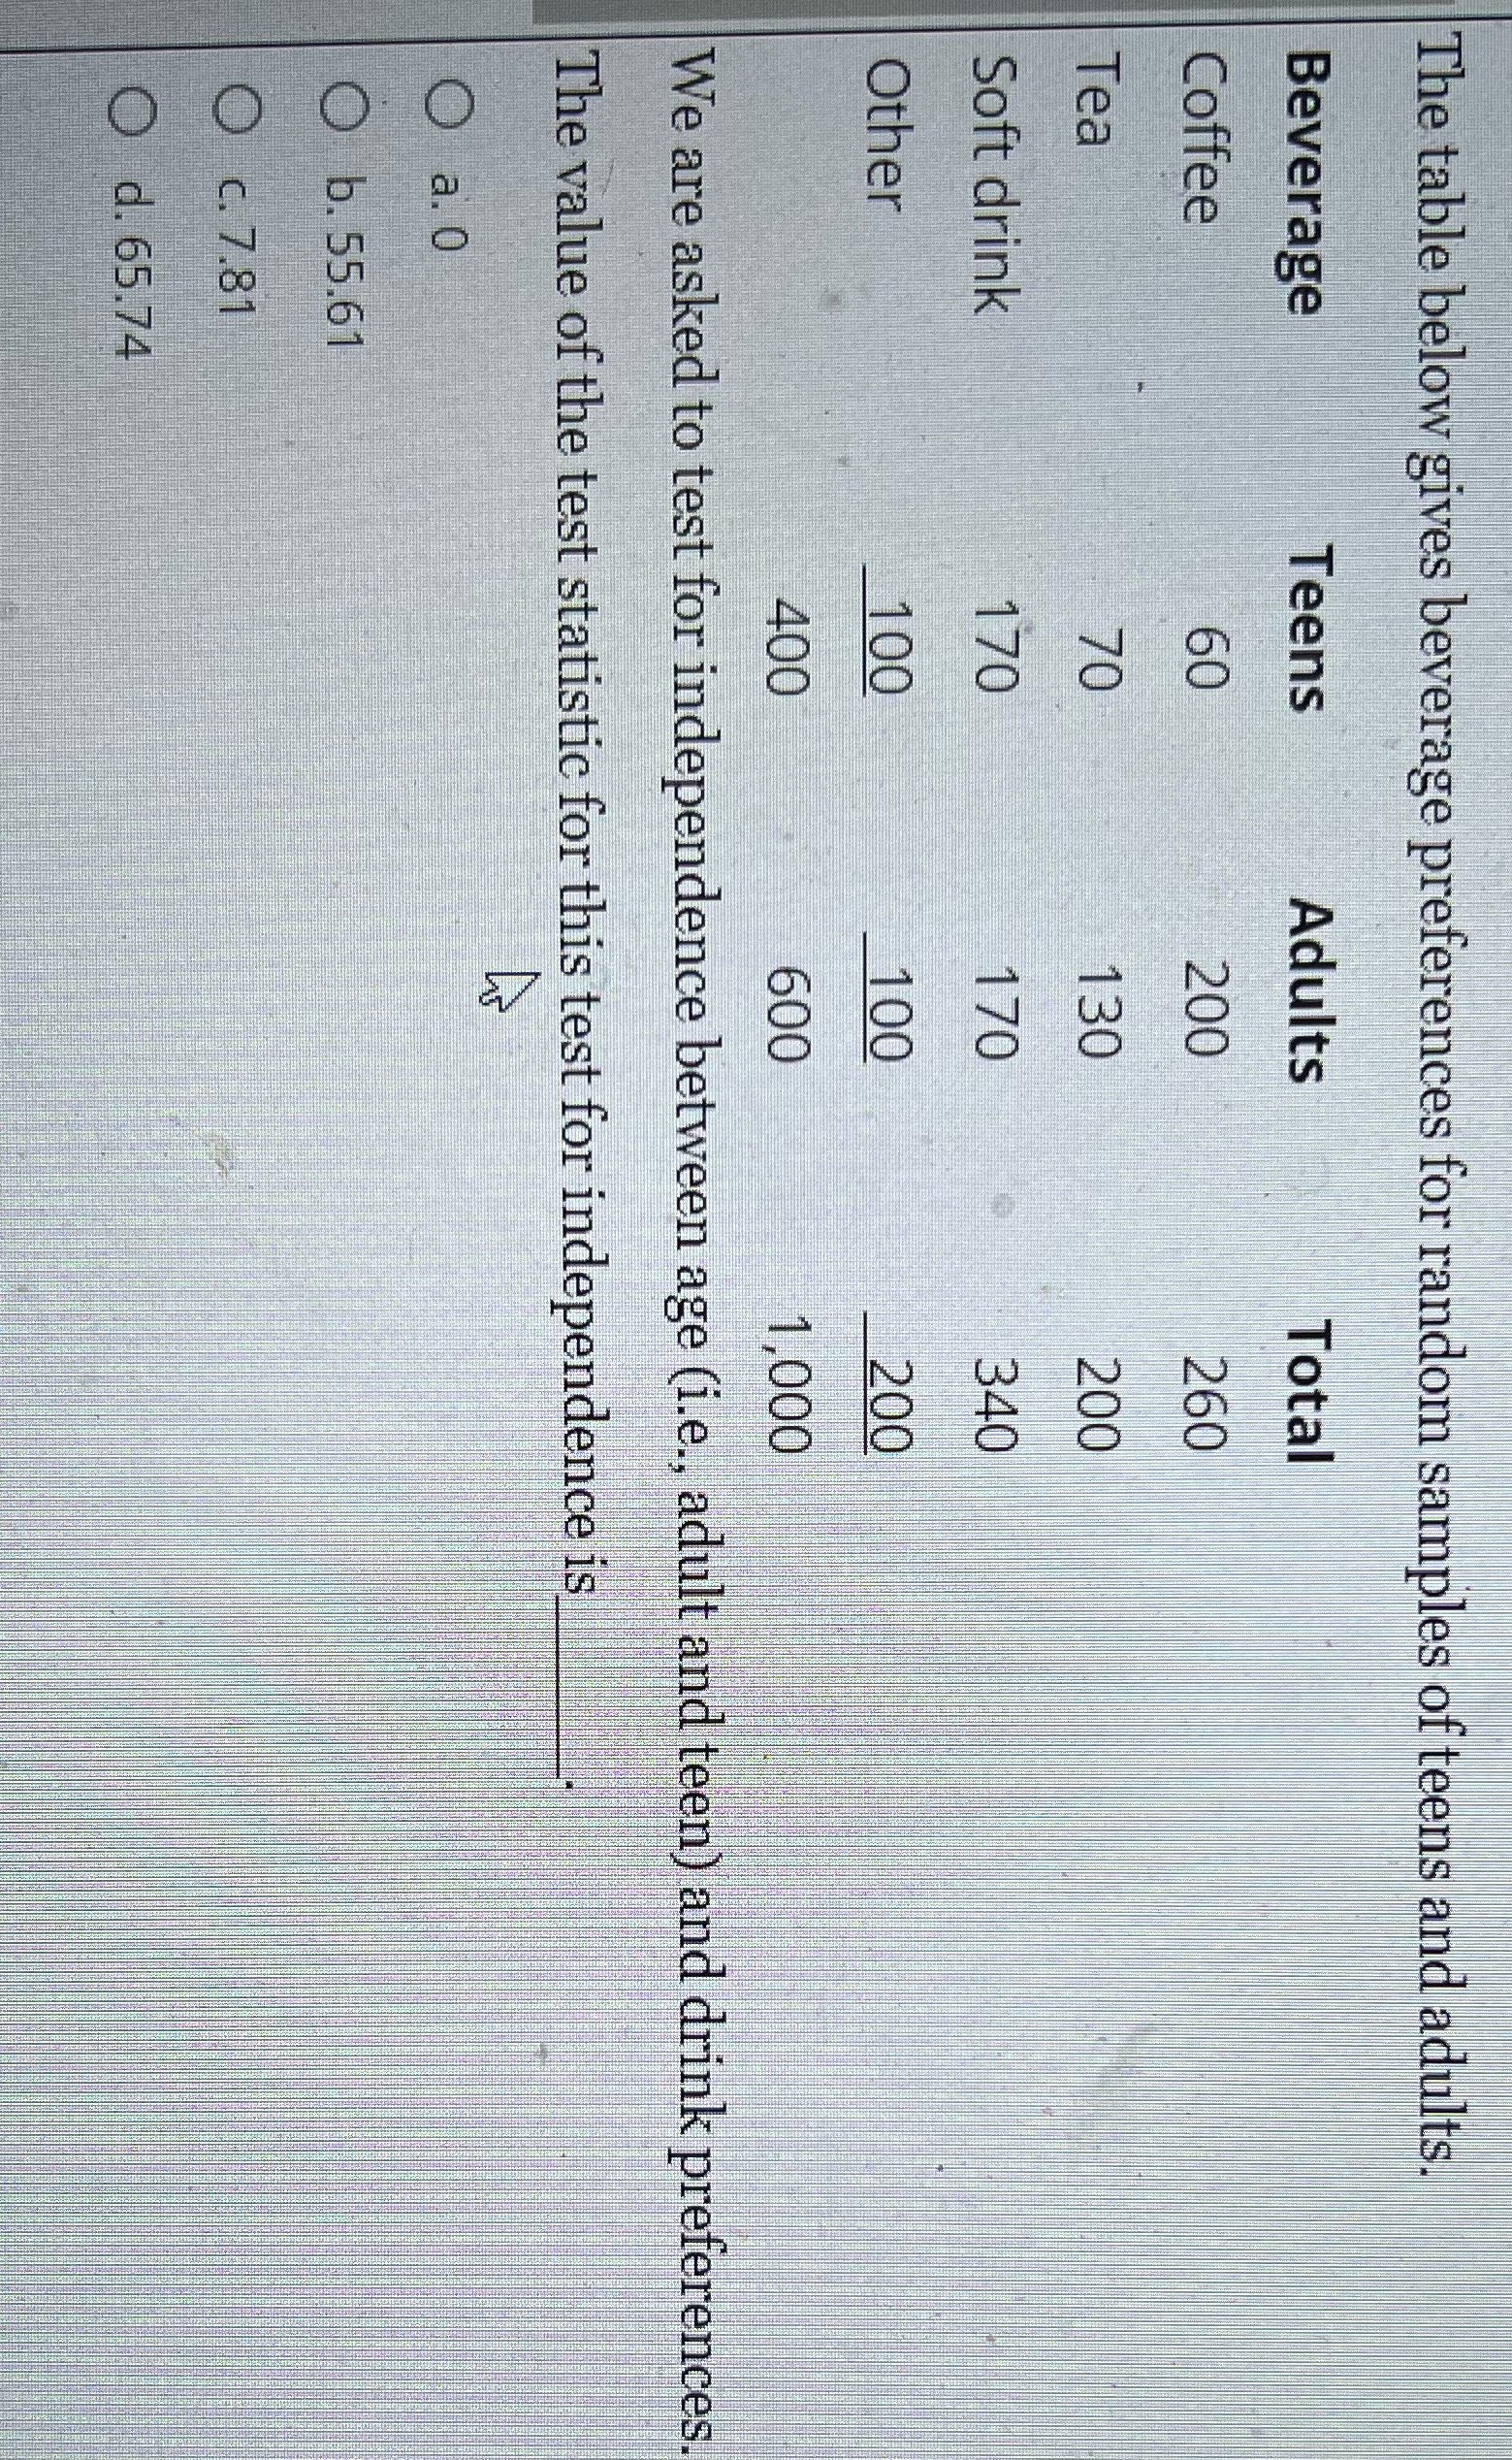
The table below gives beverage preferences for random samples of teens and adults. Beverage Teens Adults Total Coffee 200 260 Tea 130 200 Soft drink
Step by Step Solution
There are 3 Steps involved in it
Step: 1

Get Instant Access to Expert-Tailored Solutions
See step-by-step solutions with expert insights and AI powered tools for academic success
Step: 2

Step: 3
Ace Your Homework with AI
Get the answers you need in no time with our AI-driven, step-by-step assistance
Get Started
Calculus (Single Variable)
Authors: Michael Sullivan
1st Edition
1464142912, 9781464142918