

Answered step by step
Verified Expert Solution
Question
1 Approved Answer
The table below gives the estimated carbon dioxide ( C O 2 ) emissions of a random planet over the last century. The C O
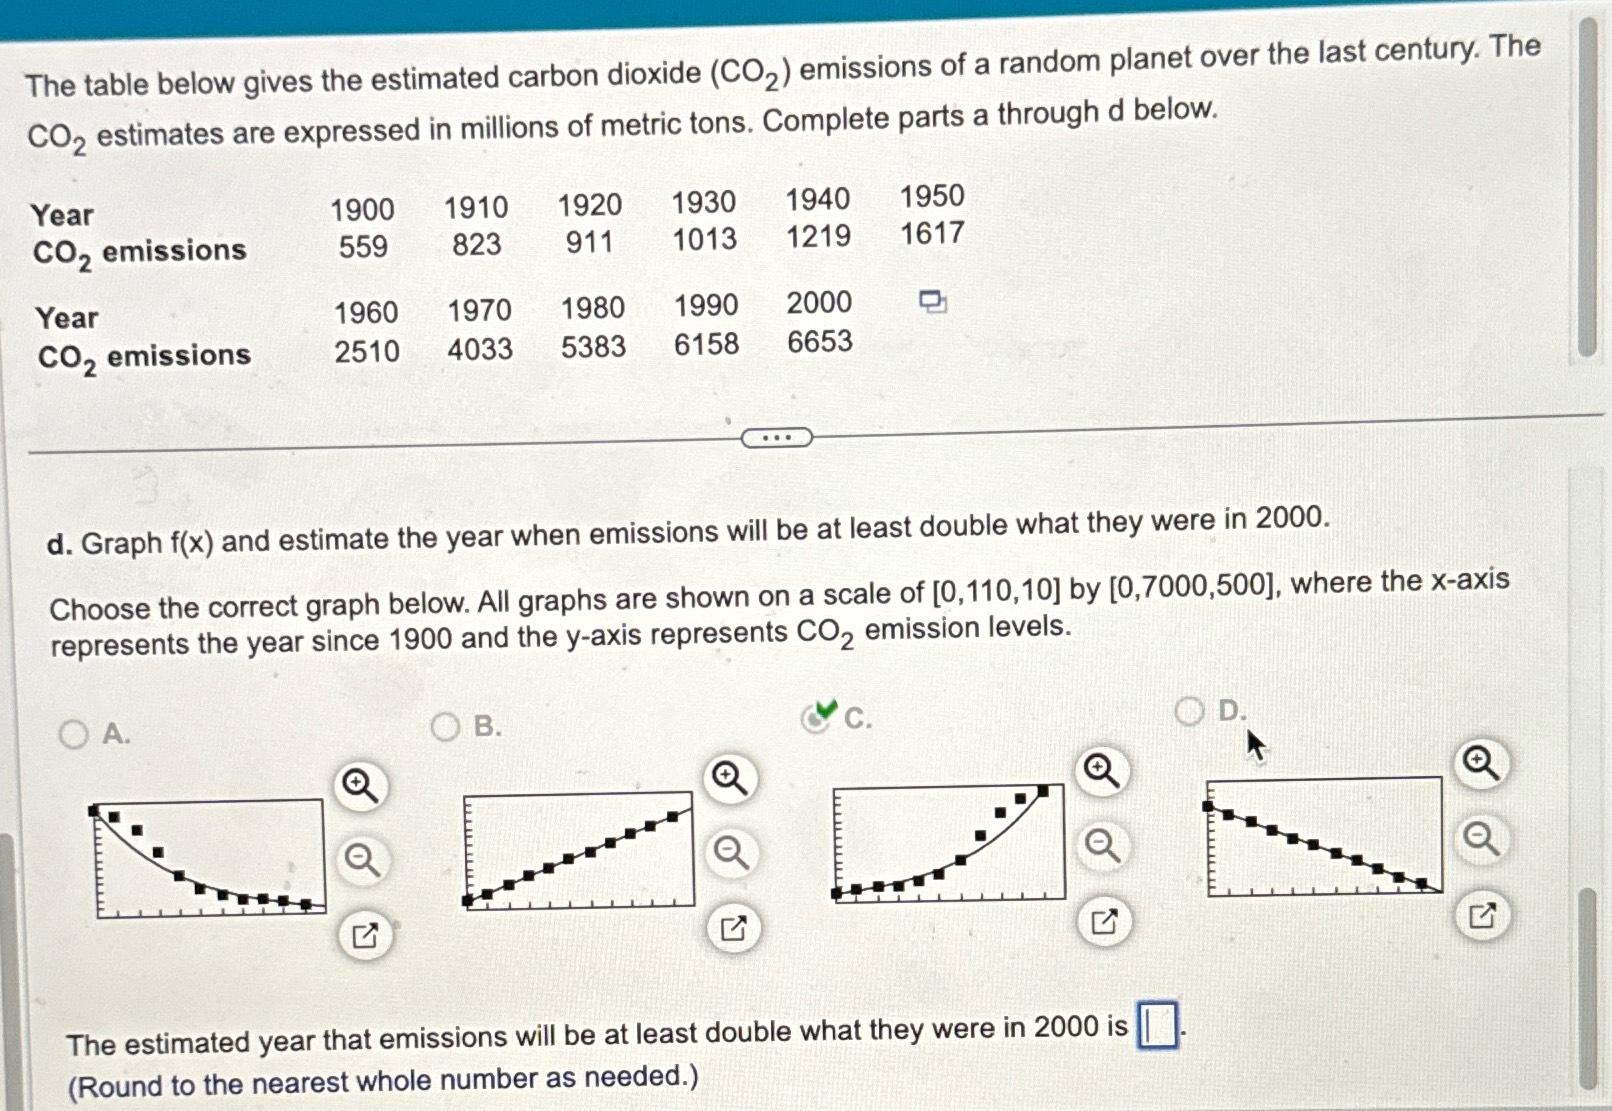
The table below gives the estimated carbon dioxide emissions of a random planet over the last century. The estimates are expressed in millions of metric tons. Complete parts a through below.
tableYear emissions,Year emissions,
d Graph and estimate the year when emissions will be at least double what they were in
Choose the correct graph below. All graphs are shown on a scale of by where the axis represents the year since and the axis represents emission levels.
A
B
c
D
Q
The estimated year that emissions will be at least double what they were in is Round to the nearest whole number as needed.
Step by Step Solution
There are 3 Steps involved in it
Step: 1

Get Instant Access to Expert-Tailored Solutions
See step-by-step solutions with expert insights and AI powered tools for academic success
Step: 2

Step: 3
Ace Your Homework with AI
Get the answers you need in no time with our AI-driven, step-by-step assistance
Get Started
Elementary Statisitcs
Authors: Barry Monk
2nd edition
1259345297, 978-0077836351, 77836359, 978-1259295911, 1259295915, 978-1259292484, 1259292487, 978-1259345296