

Answered step by step
Verified Expert Solution
Question
1 Approved Answer
The table below gives U.S. lead emissions, , into the environment in millions of metric tons for 1970-1992. Let =0 in 1970. For a and
The table below gives U.S. lead emissions, , into the environment in millions of metric tons for 1970-1992. Let =0 in 1970. For a and b, please provide the exact functions.
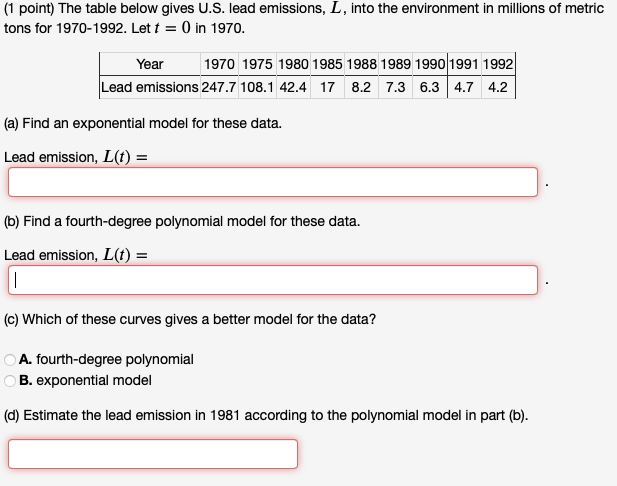 (1 point) The table below gives U.S. lead emissions, L, into the environment in millions of metric tons for 19701992. Let t=0 in 1970. (a) Find an exponential model for these data. Lead emission, L(t)= (b) Find a fourth-degree polynomial model for these data. Lead emission, L(t)= (c) Which of these curves gives a better model for the data? A. fourth-degree polynomial B. exponential model (d) Estimate the lead emission in 1981 according to the polynomial model in part (b)
 Step by Step Solution
There are 3 Steps involved in it
Step: 1

Get Instant Access to Expert-Tailored Solutions
See step-by-step solutions with expert insights and AI powered tools for academic success
Step: 2

Step: 3
Ace Your Homework with AI
Get the answers you need in no time with our AI-driven, step-by-step assistance
Get Started
M Glichkeiten Und Grenzen Der F Rderung Verantwortlichen Handelns Von Wirtschaftspr Fern In Moralisch Relevanten Situationen Eine Theoretische Und And Accounting Studies
Authors: Catharina Schmiele
2012 Edition
383493335X, 978-3834933355