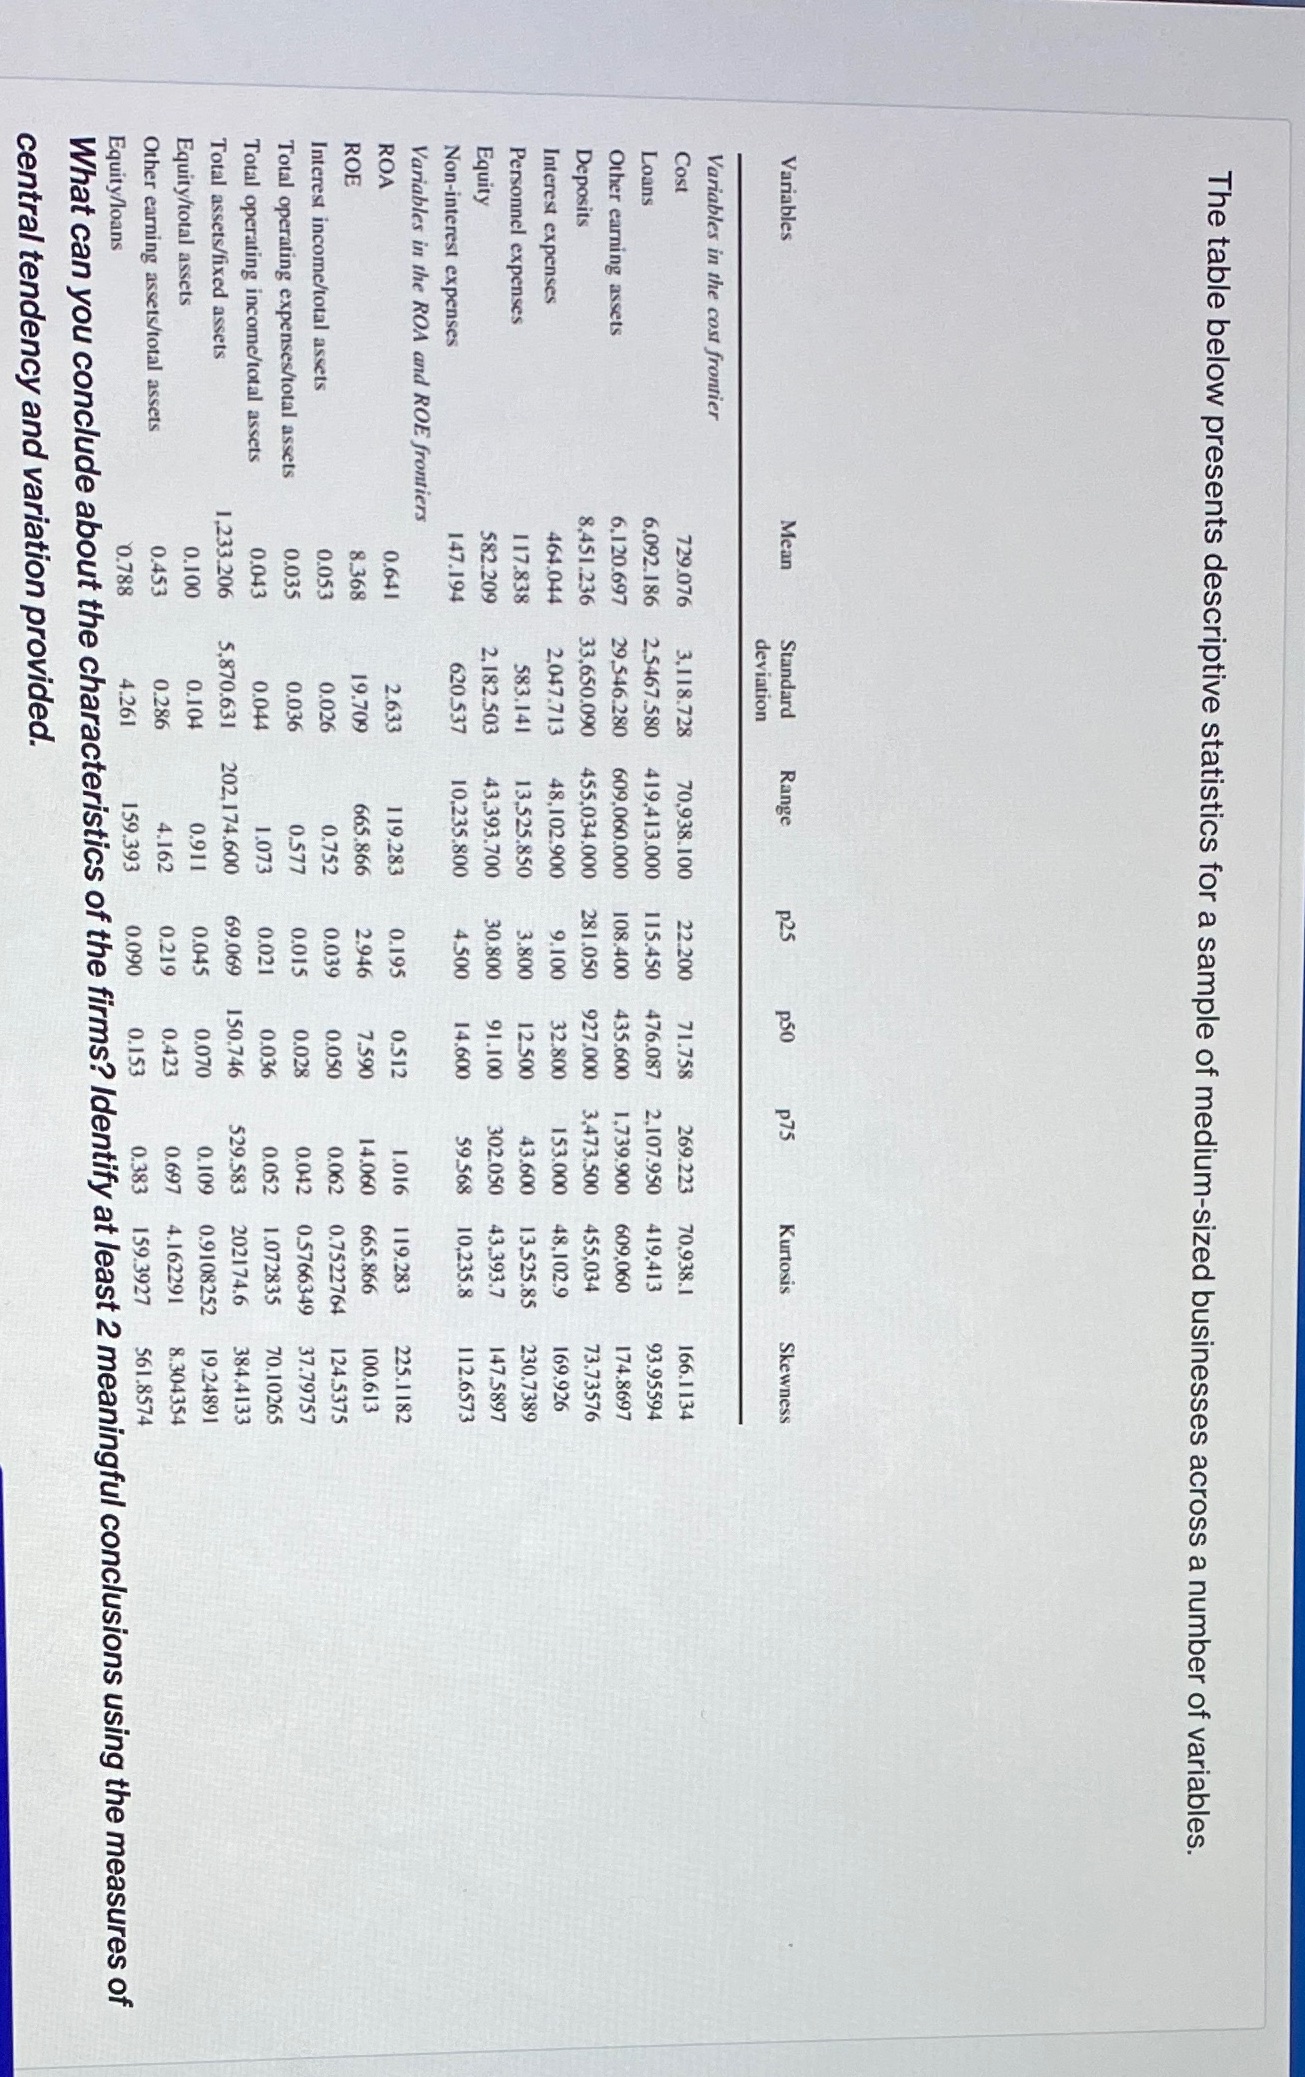
The table below presents descriptive statistics for a sample of medium-sized businesses across a number of variables. Variables Mean Standard Range P25 deviation P50 P75 Kurtosis Skewness Variables in the cost frontier Cost 729.076 3,118.728 70.938.100 22.200 71.758 269.223 70.938.1 Loans 166.1134 6.092.186 2.5467.580 419.413.000 115.450 476.087 2.107.950 419.413 93.95594 Other earning assets 6.120.697 29,546.280 609,060.000 108.400 435.600 1,739.900 609.060 174.8697 Deposits 8.451.236 33,650.090 455.034.000 281.050 927.000 3,473.500 455.034 73.73576 Interest expenses 464.044 2.047.713 48,102.900 9.100 32.800 153.000 48,102.9 169.926 Personnel expenses 1 17.838 583.141 13,525.850 3.800 12.500 43.600 13.525.85 230.7389 Equity 582.209 2.182.503 43.393.700 30.800 91.100 302.050 43.393.7 147.5897 Non-interest expenses 147.194 620.537 10.235.800 4.500 14.600 59.568 10.235.8 112.6573 Variables in the ROA and ROE frontiers ROA 0.641 2.633 1 19.283 0.195 0.512 1.016 119.283 225.1 182 ROE 8.368 19.709 665.866 2.946 7.590 14.060 665.866 100.613 Interest income/total assets 0.053 0.026 0.752 0.039 0.050 0.062 0.7522764 124.5375 Total operating expenses/total assets 0.035 0.036 0.577 0.015 0.028 0.042 0.5766349 37.79757 Total operating income/total assets 0.043 0.044 1.073 0.021 0.036 0.052 1.072835 70.10265 Total assets/fixed assets 1,233.206 5,870.631 202,174.600 69.069 150.746 529.583 202174.6 384.4133 Equity/total assets 0.100 0.104 0.911 0.045 0.070 0.109 0.9108252 19.24891 Other earning assets/total assets 0.453 0.286 4.162 0.219 0.423 0.697 4.162291 8.304354 Equity/loans 0.788 4.261 159.393 0.090 0.153 0.383 159.3927 561.8574 What can you conclude about the characteristics of the firms? Identify at least 2 meaningful conclusions using the measures of central tendency and variation provided