

Question
The table below presents the Total Benefits (TB) and Total Costs (TC) of producing at a certain level of activity (A). Plot the TB and
The table below presents the Total Benefits (TB) and Total Costs (TC) of producing at a certain level of activity (A).
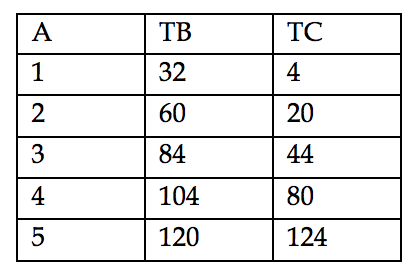
Plot the TB and TB functions in the chart below.
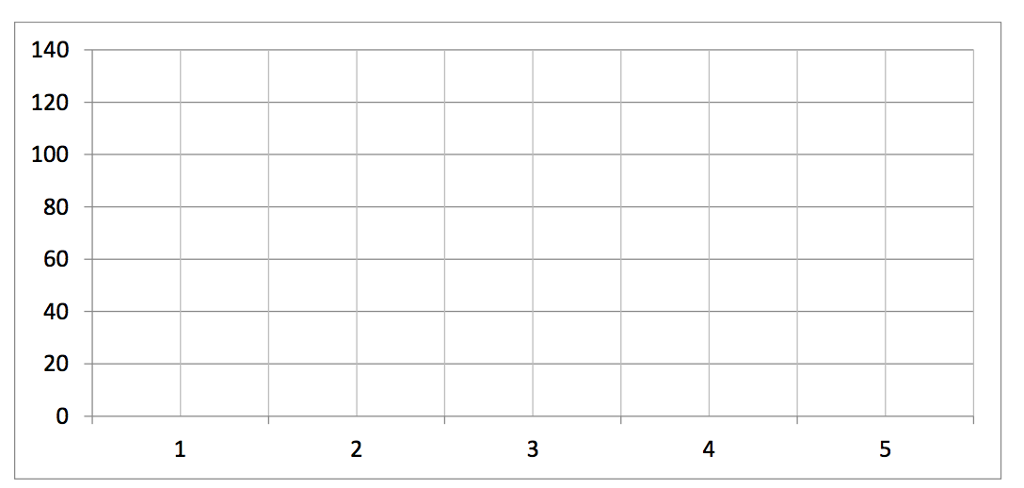 Show in your chart the point of intersecting. What happens after that point?
By a simple eyeballing, what do you think would be the point in which the maximum Net Benefit could be obtained? Explain answer.
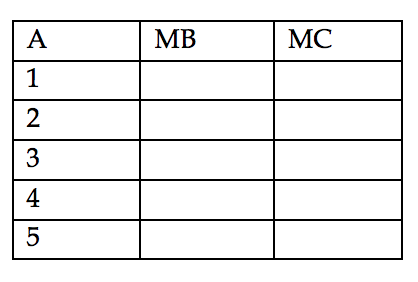
Estimate the Marginal Benefit (MB) and Marginal Cost (MC) of adding one extra unit of activity.
Write your results in the table below
Step by Step Solution
There are 3 Steps involved in it
Step: 1

Get Instant Access to Expert-Tailored Solutions
See step-by-step solutions with expert insights and AI powered tools for academic success
Step: 2

Step: 3
Ace Your Homework with AI
Get the answers you need in no time with our AI-driven, step-by-step assistance
Get Started
Auditing Information Security A Complete Guide
Authors: Gerardus Blokdyk
2020 Edition
1867303531, 978-1867303534