Question
The table below presents the year-end prices for the shares of Ford and PPG from 2002 to 2014: a) Calculate the following statistics for these
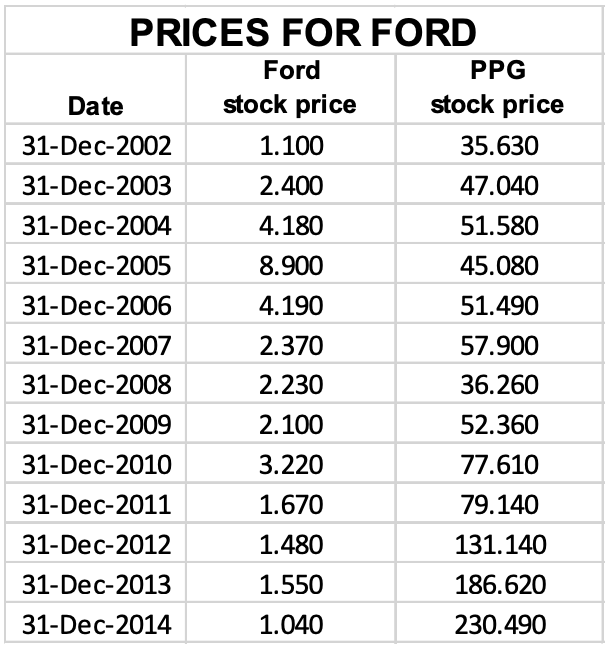
The table below presents the year-end prices for the shares of Ford and PPG from 2002 to 2014:
a) Calculate the following statistics for these two shares: average return, variance of returns, standard deviation of returns, covariance of returns and correlation coefficient. b) If you invested in ta portfolio comprised of 50% Ford and 50% PPG what would be the expected portfolio return and standard deviation? c) Comment on the following statement: Ford has lower returns and higher standard deviation of returns that PPG. Therefore any rational investor would invest in PPG only and would leave Ford out of her portfolio.
PRICES FOR FORD Ford PPG Date stock price stock price 31-Dec-2002 1.100 35.630 31-Dec-2003 2.400 47.040 31-Dec-2004 4.180 51.580 31-Dec-2005 8.900 45.080 31-Dec-2006 4.190 51.490 31-Dec-2007 2.370 57.900 31-Dec-2008 2.230 36.260 31-Dec-2009 2.100 52.360 31-Dec-2010 3.220 77.610 31-Dec-2011 1.670 79.140 31-Dec-2012 1.480 131.140 31-Dec-2013 1.550 186.620 31-Dec-2014 1.040 230.490Step by Step Solution
There are 3 Steps involved in it
Step: 1

Get Instant Access to Expert-Tailored Solutions
See step-by-step solutions with expert insights and AI powered tools for academic success
Step: 2

Step: 3
Ace Your Homework with AI
Get the answers you need in no time with our AI-driven, step-by-step assistance
Get Started