

Answered step by step
Verified Expert Solution
Question
1 Approved Answer
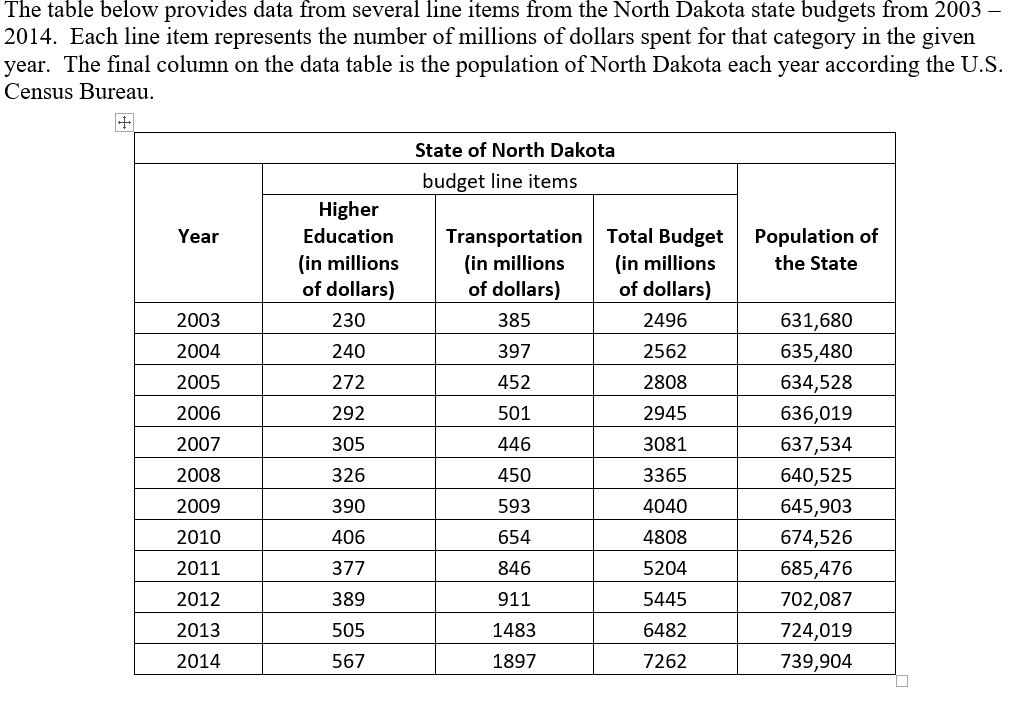
The table below provides data from several line items from the North Dakota state budgets from 2003 2014. Each line item represents the number of
Step by Step Solution
There are 3 Steps involved in it
Step: 1

Get Instant Access to Expert-Tailored Solutions
See step-by-step solutions with expert insights and AI powered tools for academic success
Step: 2

Step: 3
Ace Your Homework with AI
Get the answers you need in no time with our AI-driven, step-by-step assistance
Get Started
Birds Higher Engineering Mathematics
Authors: John Bird
9th Edition
1000353036, 9781000353037