

Answered step by step
Verified Expert Solution
Question
1 Approved Answer
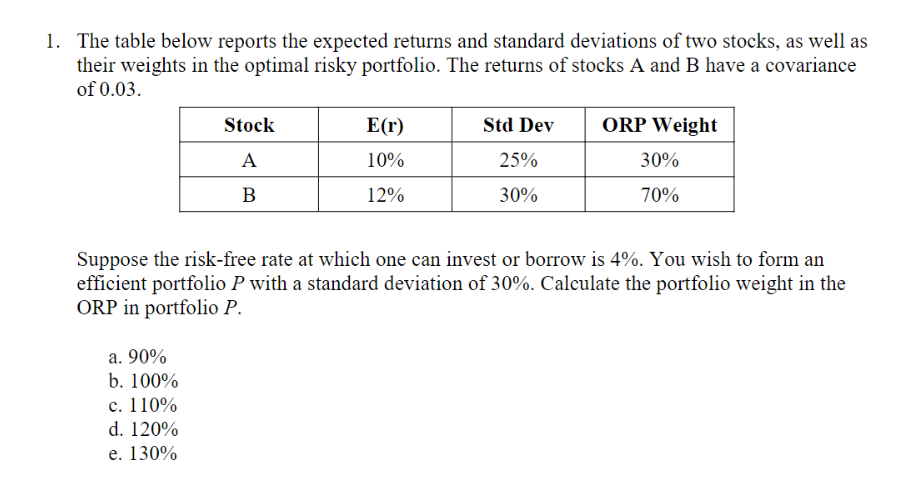
The table below reports the expected returns and standard deviations of two stocks, as well as their weights in the optimal risky portfolio. The returns
Step by Step Solution
There are 3 Steps involved in it
Step: 1

Get Instant Access to Expert-Tailored Solutions
See step-by-step solutions with expert insights and AI powered tools for academic success
Step: 2

Step: 3
Ace Your Homework with AI
Get the answers you need in no time with our AI-driven, step-by-step assistance
Get Started
Focus On Personal Finance
Authors: Jack Kapoor, Les Dlabay, Robert J. Hughes, Melissa Hart
7th Edition
1265521972, 978-1265521974