Answered step by step
Verified Expert Solution
Question
1 Approved Answer
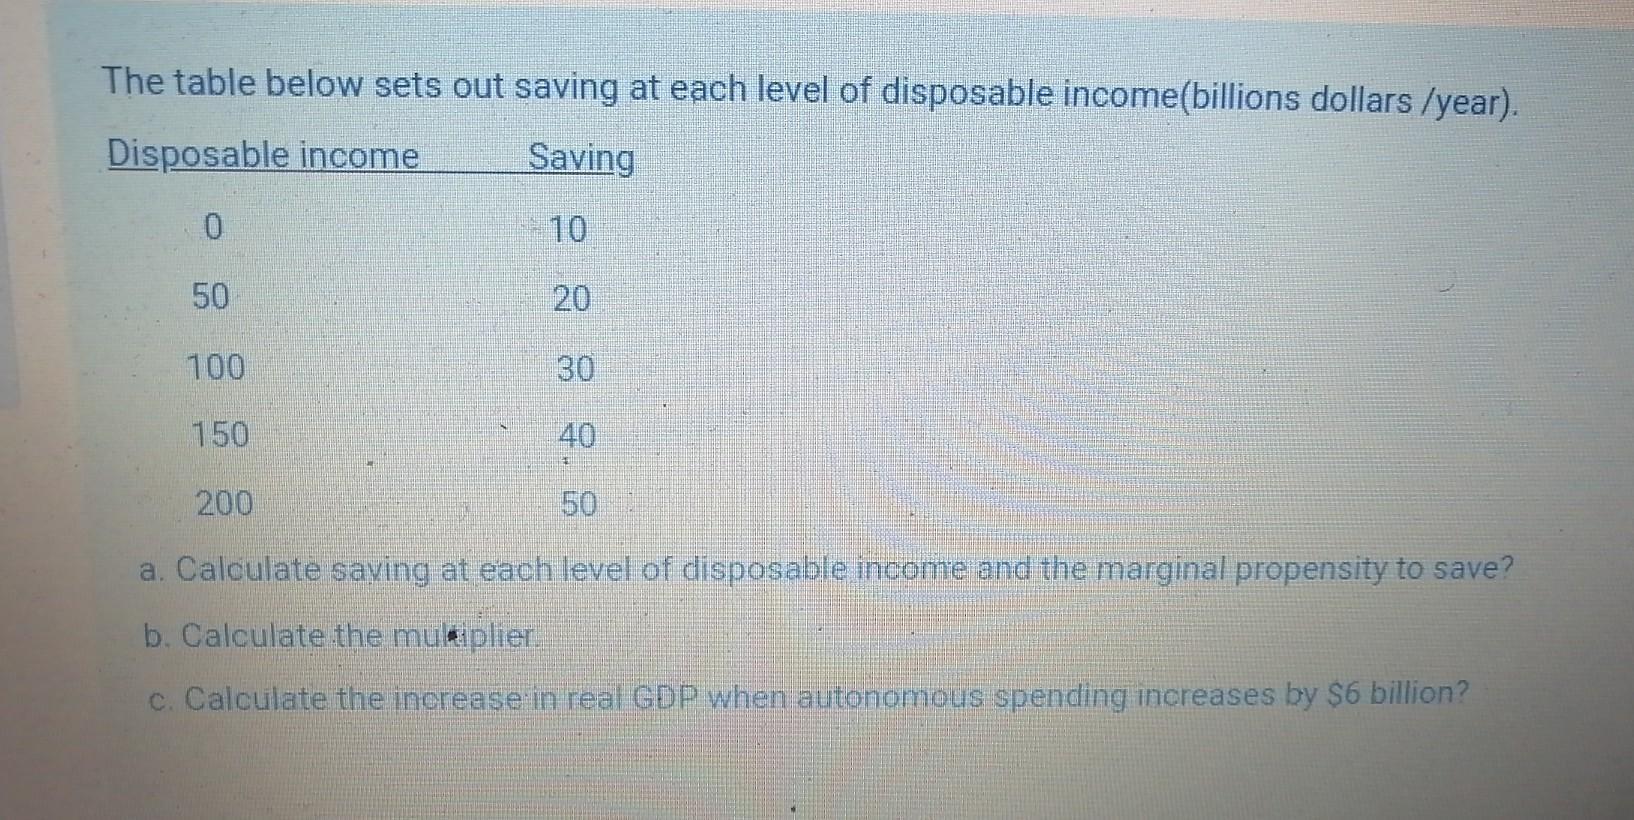
The table below sets out saving at each level of disposable income (billions dollars /year). Disposable income Saving 0 10 50 20 100 150

The table below sets out saving at each level of disposable income (billions dollars /year). Disposable income Saving 0 10 50 20 100 150 30 40 200 50 a. Calculate saving at each level of disposable income and the marginal propensity to save? b. Calculate the multiplier. c. Calculate the increase in real GDP when autonomous spending increases by $6 billion? C 100 20 The table below sets out saving at each level of disposable income (billions dollars /year). Disposable income Saving 0 10 50 20 100 150 30 40 200 50 a. Calculate saving at each level of disposable income and the marginal propensity to save? b. Calculate the multiplier. c. Calculate the increase in real GDP when autonomous spending increases by $6 billion? C 100 20
Step by Step Solution
★★★★★
3.50 Rating (153 Votes )
There are 3 Steps involved in it
Step: 1
a Saving Disposable Income x Marginal Propensity to Save 10 0 x Marginal Propensity to ...
Get Instant Access to Expert-Tailored Solutions
See step-by-step solutions with expert insights and AI powered tools for academic success
Step: 2

Step: 3

Ace Your Homework with AI
Get the answers you need in no time with our AI-driven, step-by-step assistance
Get Started


