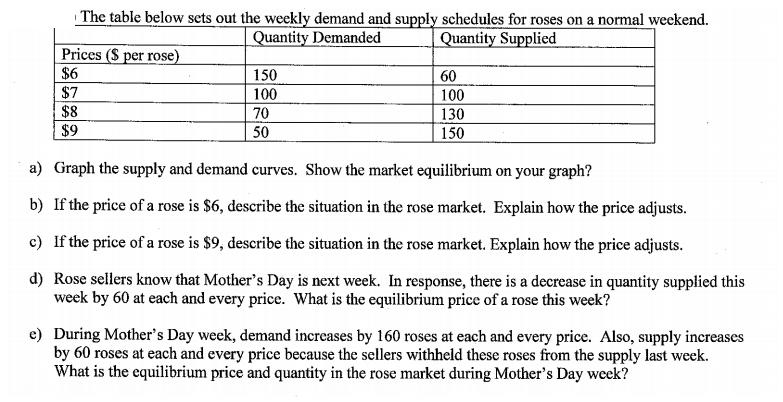
Question: The table below sets out the weekly demand and supply schedules for roses on a normal weekend. Quantity Demanded Quantity Supplied Prices ($ per

The table below sets out the weekly demand and supply schedules for roses on a normal weekend. Quantity Demanded Quantity Supplied Prices ($ per rose) $6 $7 $8 $9 150 100 70 50 60 100 130 150 a) Graph the supply and demand curves. Show the market equilibrium on your graph? b) If the price of a rose is $6, describe the situation in the rose market. Explain how the price adjusts. c) If the price of a rose is $9, describe the situation in the rose market. Explain how the price adjusts. d) Rose sellers know that Mother's Day is next week. In response, there is a decrease in quantity supplied this week by 60 at each and every price. What is the equilibrium price of a rose this week? e) During Mother's Day week, demand increases by 160 roses at each and every price. Also, supply increases by 60 roses at each and every price because the sellers withheld these roses from the supply last week. What is the equilibrium price and quantity in the rose market during Mother's Day week?
Step by Step Solution
3.49 Rating (162 Votes )
There are 3 Steps involved in it
Graph The equilibrium price is 7 and the equilibrium quantity is 100 roses b If the price of a rose ... View full answer

Get step-by-step solutions from verified subject matter experts


