Question
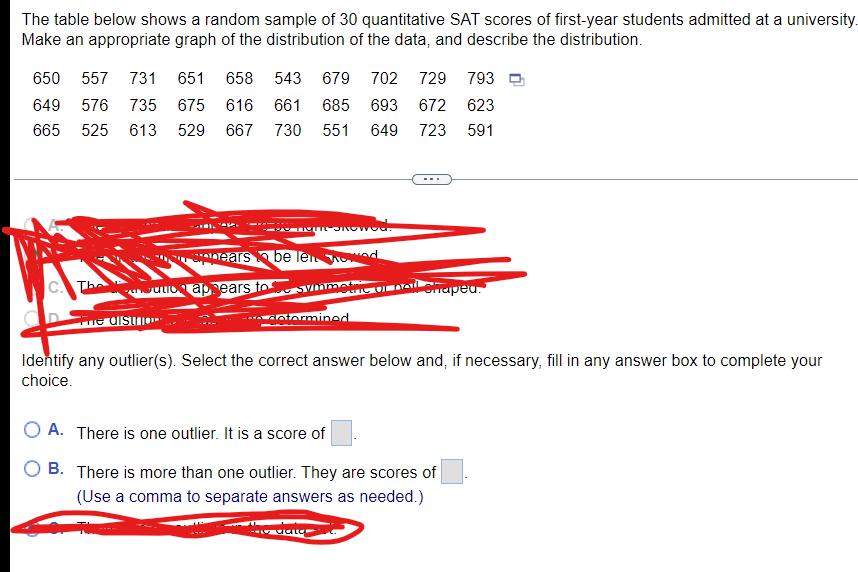
The table below shows a random sample of 30 quantitative SAT scores of first-year students admitted at a university. Make an appropriate graph of

The table below shows a random sample of 30 quantitative SAT scores of first-year students admitted at a university. Make an appropriate graph of the distribution of the data, and describe the distribution. 650 557 731 651 658 543 679 702 729 793 649 576 735 675 616 661 685 693 672 623 665 525 613 529 667 730 551 649 723 591 COROWed. appears to be len od 18. 5. CAR BOTICI SROWE C. Theutic appears to aisuio Stric ur nail Shapeu. symmetr determined Identify any outlier(s). Select the correct answer below and, if necessary, fill in any answer box to complete your choice. OA. There is one outlier. It is a score of B. There is more than one outlier. They are scores of (Use a comma to separate answers as needed.)
Step by Step Solution
3.39 Rating (155 Votes )
There are 3 Steps involved in it
Step: 1

Get Instant Access to Expert-Tailored Solutions
See step-by-step solutions with expert insights and AI powered tools for academic success
Step: 2

Step: 3

Ace Your Homework with AI
Get the answers you need in no time with our AI-driven, step-by-step assistance
Get StartedRecommended Textbook for
Introductory Statistics Exploring The World Through Data
Authors: Robert Gould, Rebecca Wong, Colleen N. Ryan
3rd Edition
0135163145, 978-0135163146
Students also viewed these Accounting questions
Question
Answered: 1 week ago
Question
Answered: 1 week ago
Question
Answered: 1 week ago
Question
Answered: 1 week ago
Question
Answered: 1 week ago
Question
Answered: 1 week ago
Question
Answered: 1 week ago
Question
Answered: 1 week ago
Question
Answered: 1 week ago
Question
Answered: 1 week ago
Question
Answered: 1 week ago
Question
Answered: 1 week ago
Question
Answered: 1 week ago
Question
Answered: 1 week ago
Question
Answered: 1 week ago
Question
Answered: 1 week ago
Question
Answered: 1 week ago
Question
Answered: 1 week ago
Question
Answered: 1 week ago
Question
Answered: 1 week ago
Question
Answered: 1 week ago
View Answer in SolutionInn App


