Answered step by step
Verified Expert Solution
Link Copied!

Question

1 Approved Answer

The table below shows fluctuations in the number of convenience stores nationwide from 2008 to 2011 based on a quantitative survey of convenience stores. Try

The table below shows fluctuations in the number of convenience stores nationwide from 2008 to 2011 based on a quantitative survey of convenience stores. Try to draw a graph. What interpretations can you draw from the graph? Right-click on the data in the graph, select Add Trendline > Linear and use the linear expression to try to get the approximation formula that indicates trends. Does it seem possible to tell what the trend is like from the equation? Can you predict from the equation how many stores there will be in December 2012?
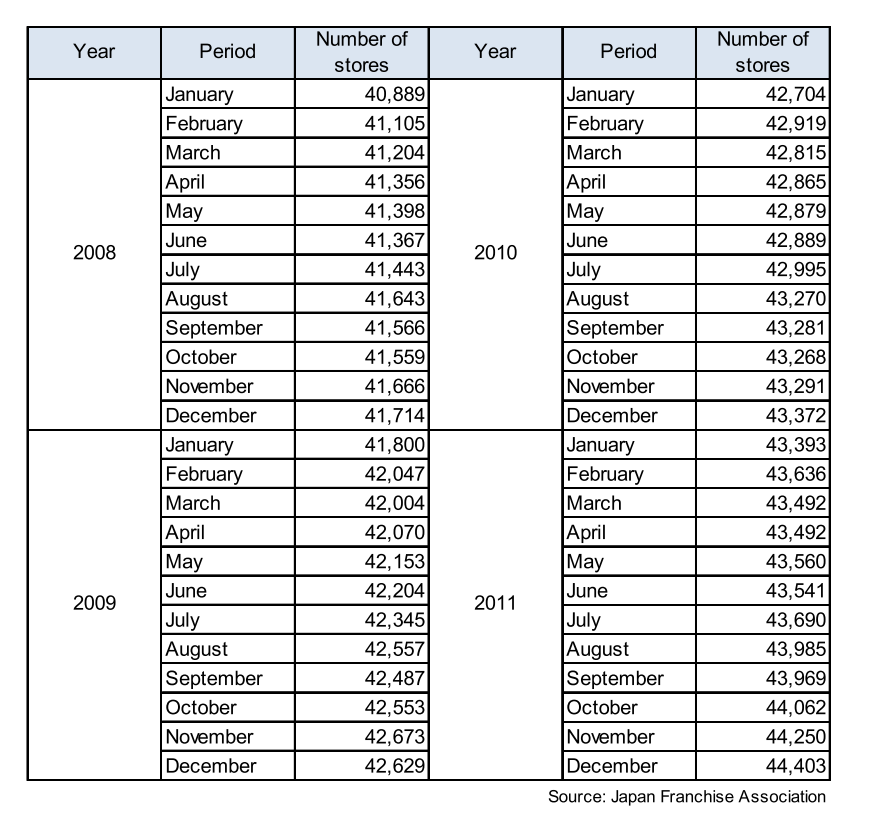
image text in transcribed
Number of Number of Year Period Year Period stores stores January 40,889 January 42,704 February 41, 105 February 42,919 March 41,204 March 42,815 Apri 41,356 April 42,865 May 41,398 May 42,879 June 41,367 June 42,889 2008 2010 July 41,443 July 42,995 August 41,643 August 43,270 September 41,566 September 43,281 October 41,559 October 43,268 November 41,666 November 43,291 December 41,714 December 43,372 January 41,800 January 43,393 February 42,047 February 43,636 March 42,004 March 43,492 April 42,070 April 43,492 May 42, 153 May 43,560 June 42,204 June 43,541 2009 2011 July 42,345 July 43,690 August 42,557 August 43,985 September 42,487 September 43,969 October 42,553 October 44,062 November 42,673 November 44,250 December 42,629 December 44,403 Source: Japan Franchise Association

Step by Step Solution

There are 3 Steps involved in it

Step: 1

blur-text-image

Get Instant Access to Expert-Tailored Solutions

See step-by-step solutions with expert insights and AI powered tools for academic success

Step: 2

blur-text-image_2

Step: 3

blur-text-image_3

Ace Your Homework with AI

Get the answers you need in no time with our AI-driven, step-by-step assistance

Get Started

Recommended Textbook for

Econometric Analysis

Authors: William H. Greene

5th Edition

130661899, 978-0130661890

More Books

Students also viewed these Economics questions

Question

What purpose do disability models serve?

Answered: 1 week ago