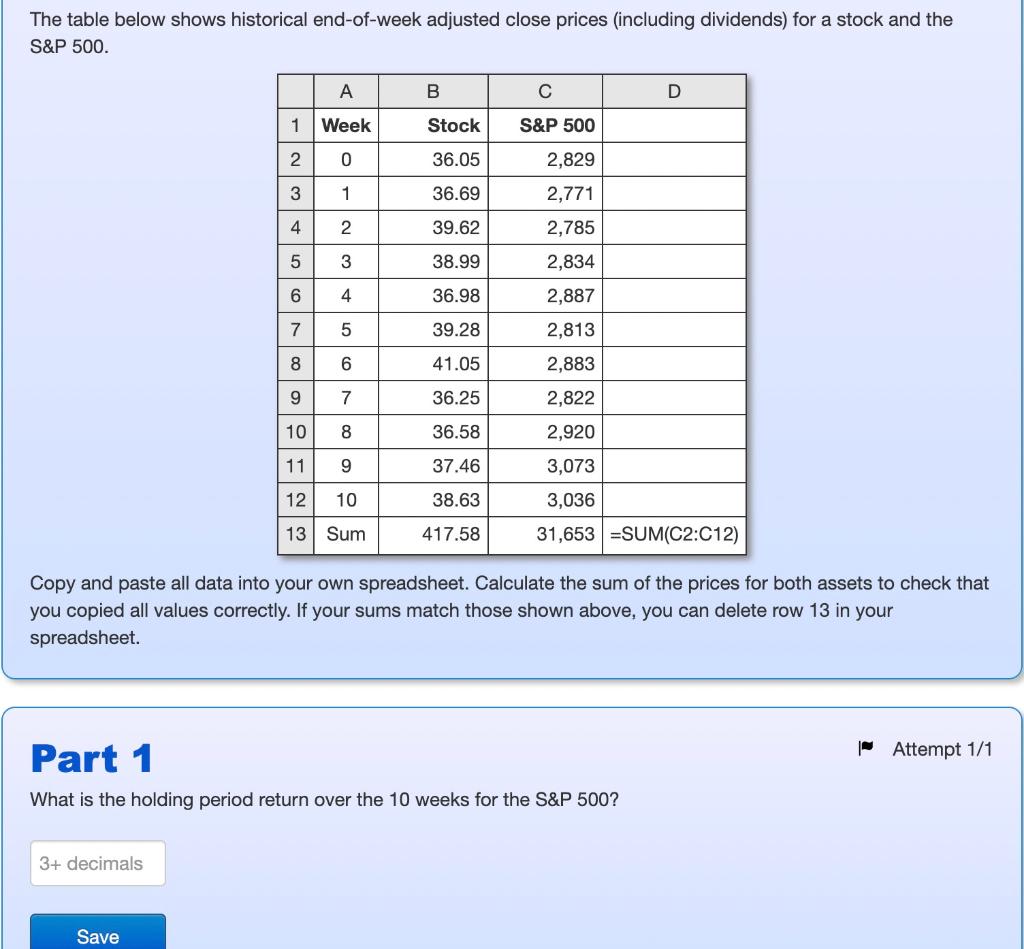
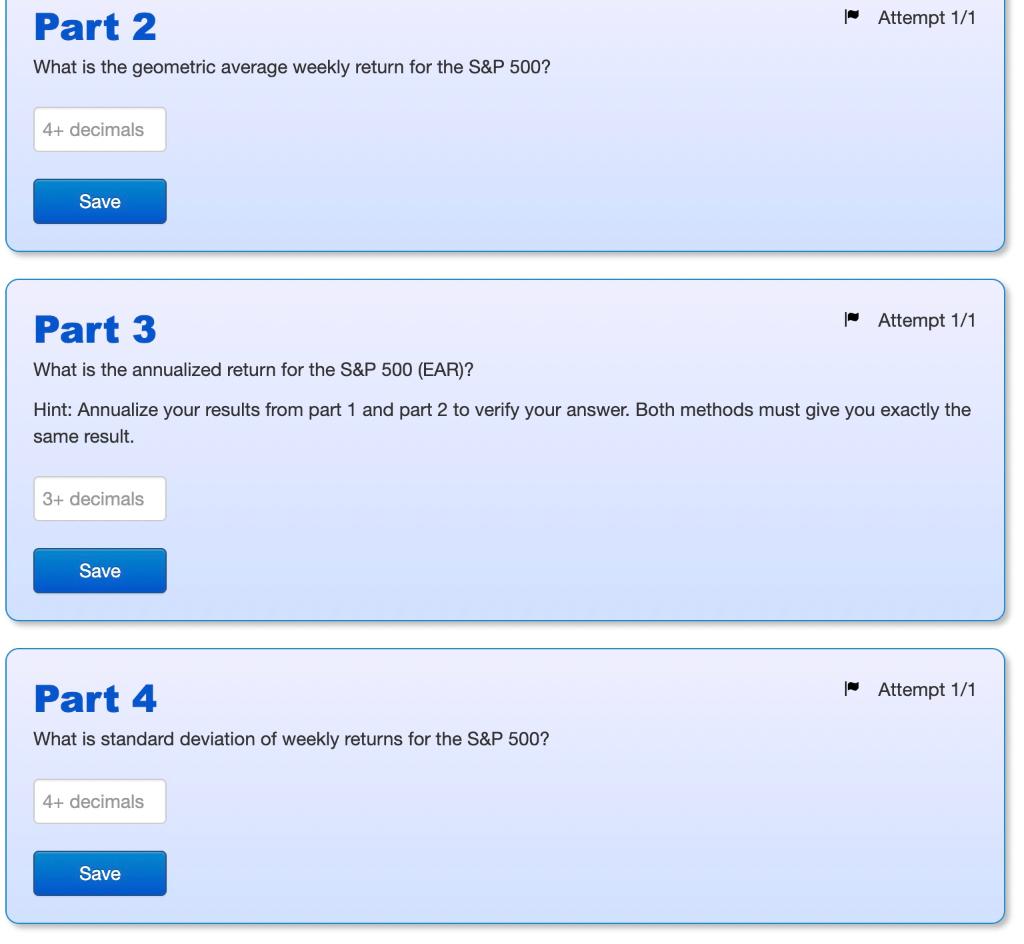
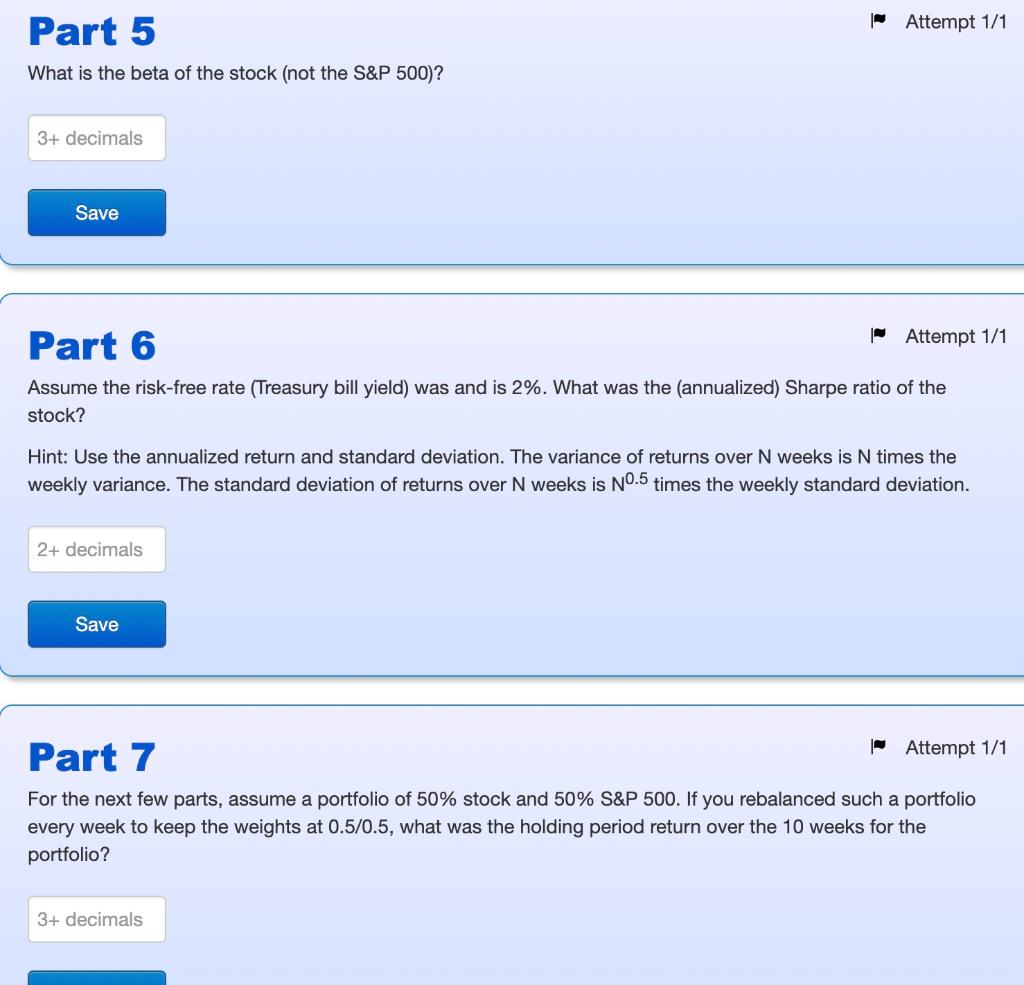
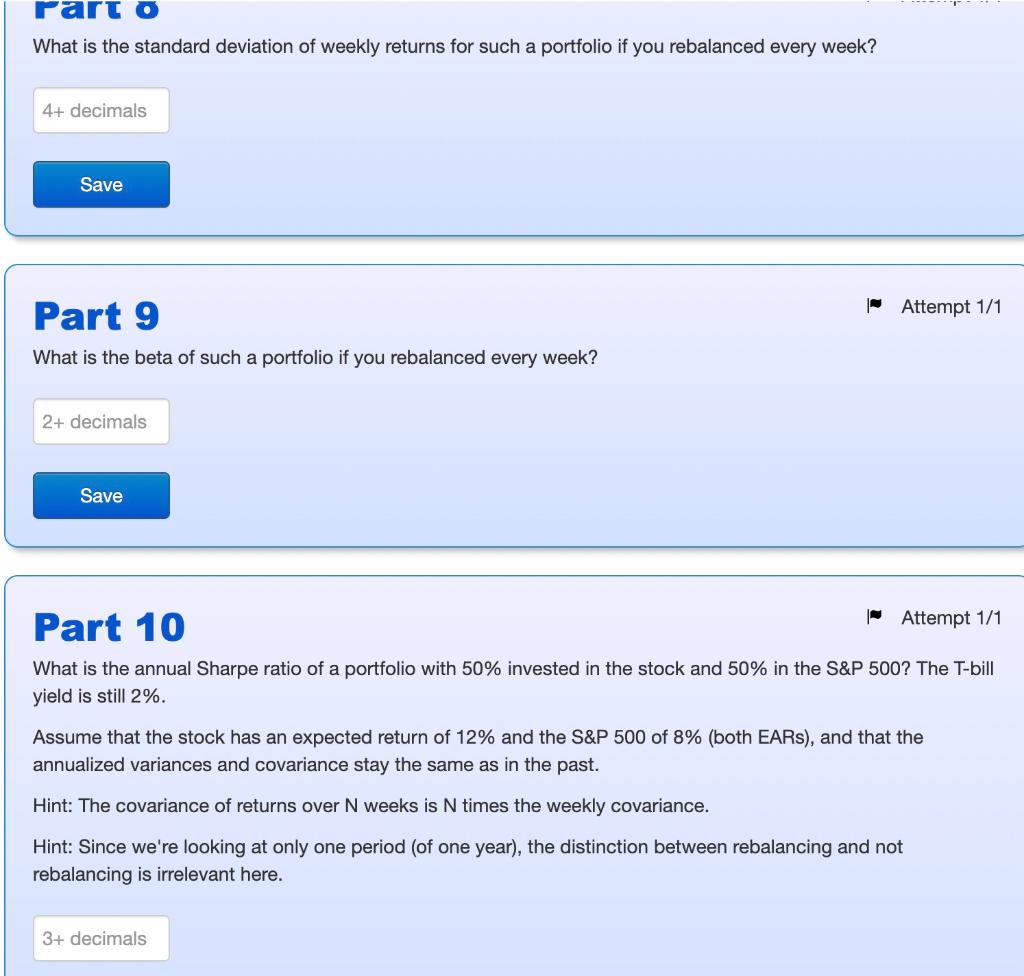
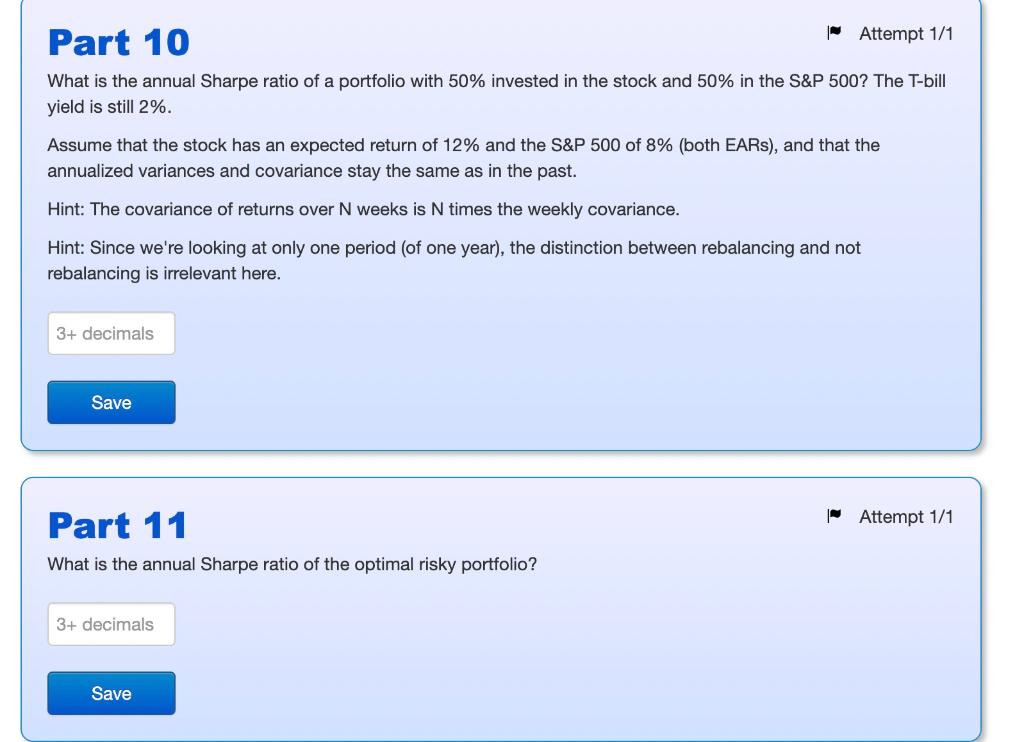
The table below shows historical end-of-week adjusted close prices (including dividends) for a stock and the S&P 500. A B C D 1 Week Stock S&P 500 2 0 36.05 2,829 3 1 36.69 2,771 4 2 39.62 2,785 5 3 38.99 2,834 6 4 36.98 2,887 7 5 39.28 2,813 8 6 41.05 2,883 9 7 36.25 2,822 10 8 36.58 2,920 11 9 37.46 3,073 12 10 38.63 3,036 13 Sum 417.58 31,653 SUM(C2:C12) Copy and paste all data into your own spreadsheet. Calculate the sum of the prices for both assets to check that you copied all values correctly. If your sums match those shown above, you can delete row 13 in your spreadsheet. Part 1 Attempt 1/1 What is the holding period return over the 10 weeks for the S&P 500? 3+ decimals Save Attempt 1/1 Part 2 What is the geometric average weekly return for the S&P 500? 4+ decimals Save Attempt 1/1 Part 3 What is the annualized return for the S&P 500 (EAR)? Hint: Annualize your results from part 1 and part 2 to verify your answer. Both methods must give you exactly the same result. 3+ decimals Save Attempt 1/1 Part 4 What is standard deviation of weekly returns for the S&P 500? 4+ decimals Save Attempt 1/1 Part 5 What is the beta of the stock (not the S&P 500)? 3+ decimals Save Part 6 Attempt 1/1 Assume the risk-free rate (Treasury bill yield) was and is 2%. What was the (annualized) Sharpe ratio of the stock? Hint: Use the annualized return and standard deviation. The variance of returns over N weeks is N times the weekly variance. The standard deviation of returns over N weeks is N.5 times the weekly standard deviation. 2+ decimals Save Attempt 1/1 Part 7 For the next few parts, assume a portfolio of 50% stock and 50% S&P 500. If you rebalanced such a portfolio every week to keep the weights at 0.5/0.5, what was the holding period return over the 10 weeks for the portfolio? 3+ decimals Part o What is the standard deviation of weekly returns for such a portfolio if you rebalanced every week? 4+ decimals Save Attempt 1/1 Part 9 What is the beta of such a portfolio if you rebalanced every week? 2+ decimals Save Attempt 1/1 Part 10 What is the annual Sharpe ratio of a portfolio with 50% invested in the stock and 50% in the S&P 500? The T-bill yield is still 2%. Assume that the stock has an expected return of 12% and the S&P 500 of 8% (both EARS), and that the annualized variances and covariance stay the same as in the past. Hint: The covariance of returns over N weeks is N times the weekly covariance. Hint: Since we're looking at only one period (of one year), the distinction between rebalancing and not rebalanci is irreleva here. 3+ decimals Part 10 Attempt 1/1 What is the annual Sharpe ratio of a portfolio with 50% invested in the stock and 50% in the S&P 500? The T-bill yield is still 2%. Assume that the stock has an expected return of 12% and the S&P 500 of 8% (both EARS), and that the annualized variances and covariance stay the same as in the past. Hint: The covariance of returns over N weeks is N times the weekly covariance. Hint: Since we're looking at only one period (of one year), the distinction between rebalancing and not rebalancing is irrelevant here. 3+ decimals Save Part 11 What is the annual Sharpe ratio of the optimal risky portfolio? 3+ decimals Save Attempt 1/1 The table below shows historical end-of-week adjusted close prices (including dividends) for a stock and the S&P 500. A B C D 1 Week Stock S&P 500 2 0 36.05 2,829 3 1 36.69 2,771 4 2 39.62 2,785 5 3 38.99 2,834 6 4 36.98 2,887 7 5 39.28 2,813 8 6 41.05 2,883 9 7 36.25 2,822 10 8 36.58 2,920 11 9 37.46 3,073 12 10 38.63 3,036 13 Sum 417.58 31,653 SUM(C2:C12) Copy and paste all data into your own spreadsheet. Calculate the sum of the prices for both assets to check that you copied all values correctly. If your sums match those shown above, you can delete row 13 in your spreadsheet. Part 1 Attempt 1/1 What is the holding period return over the 10 weeks for the S&P 500? 3+ decimals Save Attempt 1/1 Part 2 What is the geometric average weekly return for the S&P 500? 4+ decimals Save Attempt 1/1 Part 3 What is the annualized return for the S&P 500 (EAR)? Hint: Annualize your results from part 1 and part 2 to verify your answer. Both methods must give you exactly the same result. 3+ decimals Save Attempt 1/1 Part 4 What is standard deviation of weekly returns for the S&P 500? 4+ decimals Save Attempt 1/1 Part 5 What is the beta of the stock (not the S&P 500)? 3+ decimals Save Part 6 Attempt 1/1 Assume the risk-free rate (Treasury bill yield) was and is 2%. What was the (annualized) Sharpe ratio of the stock? Hint: Use the annualized return and standard deviation. The variance of returns over N weeks is N times the weekly variance. The standard deviation of returns over N weeks is N.5 times the weekly standard deviation. 2+ decimals Save Attempt 1/1 Part 7 For the next few parts, assume a portfolio of 50% stock and 50% S&P 500. If you rebalanced such a portfolio every week to keep the weights at 0.5/0.5, what was the holding period return over the 10 weeks for the portfolio? 3+ decimals Part o What is the standard deviation of weekly returns for such a portfolio if you rebalanced every week? 4+ decimals Save Attempt 1/1 Part 9 What is the beta of such a portfolio if you rebalanced every week? 2+ decimals Save Attempt 1/1 Part 10 What is the annual Sharpe ratio of a portfolio with 50% invested in the stock and 50% in the S&P 500? The T-bill yield is still 2%. Assume that the stock has an expected return of 12% and the S&P 500 of 8% (both EARS), and that the annualized variances and covariance stay the same as in the past. Hint: The covariance of returns over N weeks is N times the weekly covariance. Hint: Since we're looking at only one period (of one year), the distinction between rebalancing and not rebalanci is irreleva here. 3+ decimals Part 10 Attempt 1/1 What is the annual Sharpe ratio of a portfolio with 50% invested in the stock and 50% in the S&P 500? The T-bill yield is still 2%. Assume that the stock has an expected return of 12% and the S&P 500 of 8% (both EARS), and that the annualized variances and covariance stay the same as in the past. Hint: The covariance of returns over N weeks is N times the weekly covariance. Hint: Since we're looking at only one period (of one year), the distinction between rebalancing and not rebalancing is irrelevant here. 3+ decimals Save Part 11 What is the annual Sharpe ratio of the optimal risky portfolio? 3+ decimals Save Attempt 1/1