

Answered step by step
Verified Expert Solution
Question
1 Approved Answer
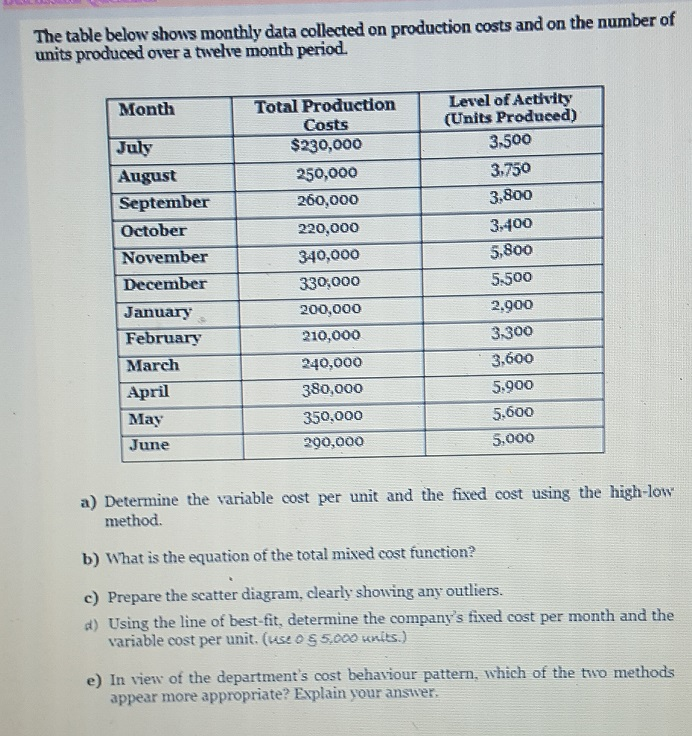
The table below shows monthly data collected on production costs and on the number of units produced over a twelve month period. Month July August
Step by Step Solution
There are 3 Steps involved in it
Step: 1

Get Instant Access to Expert-Tailored Solutions
See step-by-step solutions with expert insights and AI powered tools for academic success
Step: 2

Step: 3
Ace Your Homework with AI
Get the answers you need in no time with our AI-driven, step-by-step assistance
Get Started
Make It Complete A Guide Of Knowledge Advice And Tips For Internal Audit And Compliance
Authors: Mónica Ramírez Chimal
1st Edition
6202304456, 978-6202304450