

Answered step by step
Verified Expert Solution
Question
1 Approved Answer
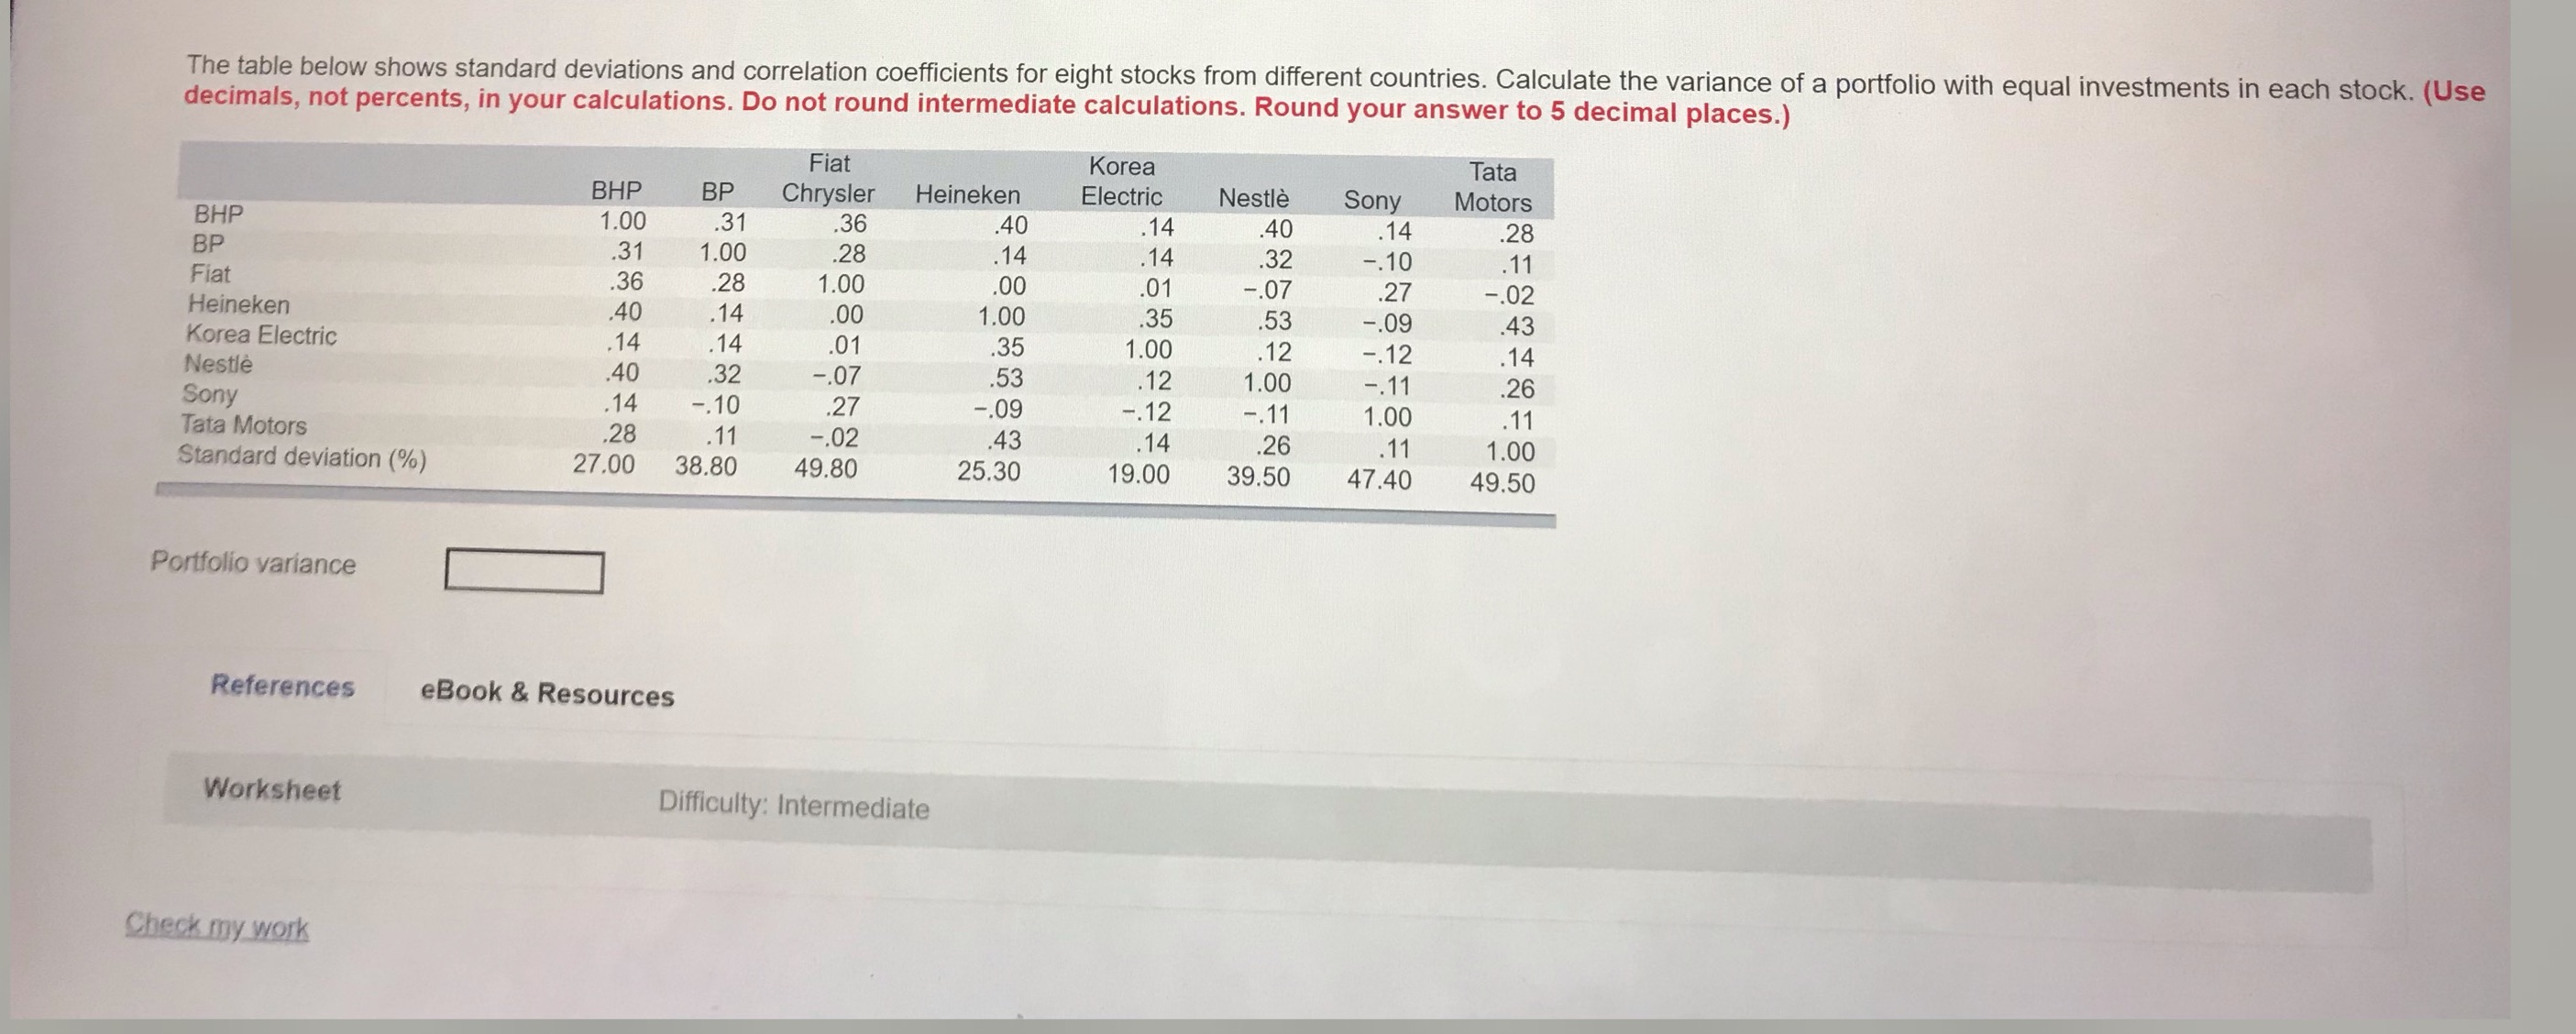
The table below shows standard deviations and correlation coefficients for eight stocks from different countries. Calculate the variance of a portfolio with equal investments in

Step by Step Solution
There are 3 Steps involved in it
Step: 1

Get Instant Access to Expert-Tailored Solutions
See step-by-step solutions with expert insights and AI powered tools for academic success
Step: 2

Step: 3
Ace Your Homework with AI
Get the answers you need in no time with our AI-driven, step-by-step assistance
Get Started
Contemporary Financial Management
Authors: R. Charles Moyer, James R. McGuigan, Ramesh P. Rao
14th edition
1337090581, 978-1337090582