Answered step by step
Verified Expert Solution
Link Copied!

Question

1 Approved Answer

The table below shows the annual growth rate of return for each year. 2010 2011 2012 2013 2014 20.18% 14.71% 12.65% -4.27% 7.44% For the
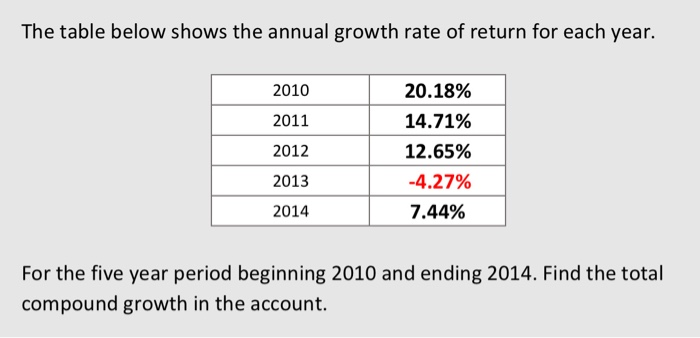
image text in transcribed
The table below shows the annual growth rate of return for each year. 2010 2011 2012 2013 2014 20.18% 14.71% 12.65% -4.27% 7.44% For the five year period beginning 2010 and ending 2014. Find the total compound growth in the account

Step by Step Solution

There are 3 Steps involved in it

Step: 1

blur-text-image

Get Instant Access to Expert-Tailored Solutions

See step-by-step solutions with expert insights and AI powered tools for academic success

Step: 2

blur-text-image

Step: 3

blur-text-image

Ace Your Homework with AI

Get the answers you need in no time with our AI-driven, step-by-step assistance

Get Started

Recommended Textbook for

Cases in Financial Reporting

Authors: Michael J. Sandretto

1st edition

538476796, 978-0538476799

More Books

Students also viewed these Finance questions

Question

using signal flow graph

Answered: 1 week ago