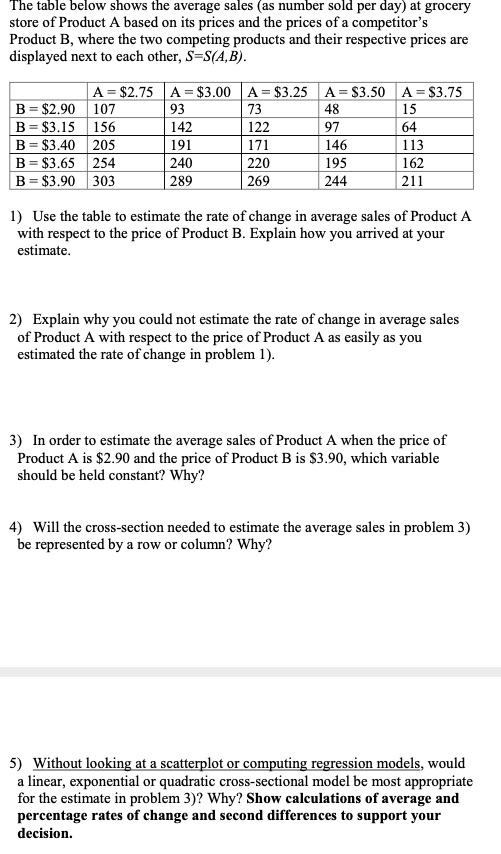
The table below shows the average sales (as number sold per day) at grocery store of Product A based on its prices and the prices of a competitor's Product B, where the two competing products and their respective prices are displayed next to each other, S=S(A,B). A = $2.75 A = $3.00 A = $3.25 A= $3.50 A = $3.75 B = $2.90 107 93 73 48 15 B = $3.15 156 142 122 97 64 B= $3.40 205 191 171 146 113 B = $3.65 254 240 220 195 162 B= $3.90 303 269 244 289 211 1) Use the table to estimate the rate of change in average sales of Product A with respect to the price of Product B. Explain how you arrived at your estimate. 2) Explain why you could not estimate the rate of change in average sales of Product A with respect to the price of Product A as easily as you estimated the rate of change in problem 1). 3) In order to estimate the average sales of Product A when the price of Product A is $2.90 and the price of Product B is $3.90, which variable should be held constant? Why? 4) Will the cross-section needed to estimate the average sales in problem 3) be represented by a row or column? Why? 5) Without looking at a scatterplot or computing regression models, would a linear, exponential or quadratic cross-sectional model be most appropriate for the estimate in problem 3)? Why? Show calculations of average and percentage rates of change and second differences to support your decision. The table below shows the average sales (as number sold per day) at grocery store of Product A based on its prices and the prices of a competitor's Product B, where the two competing products and their respective prices are displayed next to each other, S=S(A,B). A = $2.75 A = $3.00 A = $3.25 A= $3.50 A = $3.75 B = $2.90 107 93 73 48 15 B = $3.15 156 142 122 97 64 B= $3.40 205 191 171 146 113 B = $3.65 254 240 220 195 162 B= $3.90 303 269 244 289 211 1) Use the table to estimate the rate of change in average sales of Product A with respect to the price of Product B. Explain how you arrived at your estimate. 2) Explain why you could not estimate the rate of change in average sales of Product A with respect to the price of Product A as easily as you estimated the rate of change in problem 1). 3) In order to estimate the average sales of Product A when the price of Product A is $2.90 and the price of Product B is $3.90, which variable should be held constant? Why? 4) Will the cross-section needed to estimate the average sales in problem 3) be represented by a row or column? Why? 5) Without looking at a scatterplot or computing regression models, would a linear, exponential or quadratic cross-sectional model be most appropriate for the estimate in problem 3)? Why? Show calculations of average and percentage rates of change and second differences to support your decision