

Answered step by step
Verified Expert Solution
Question
1 Approved Answer
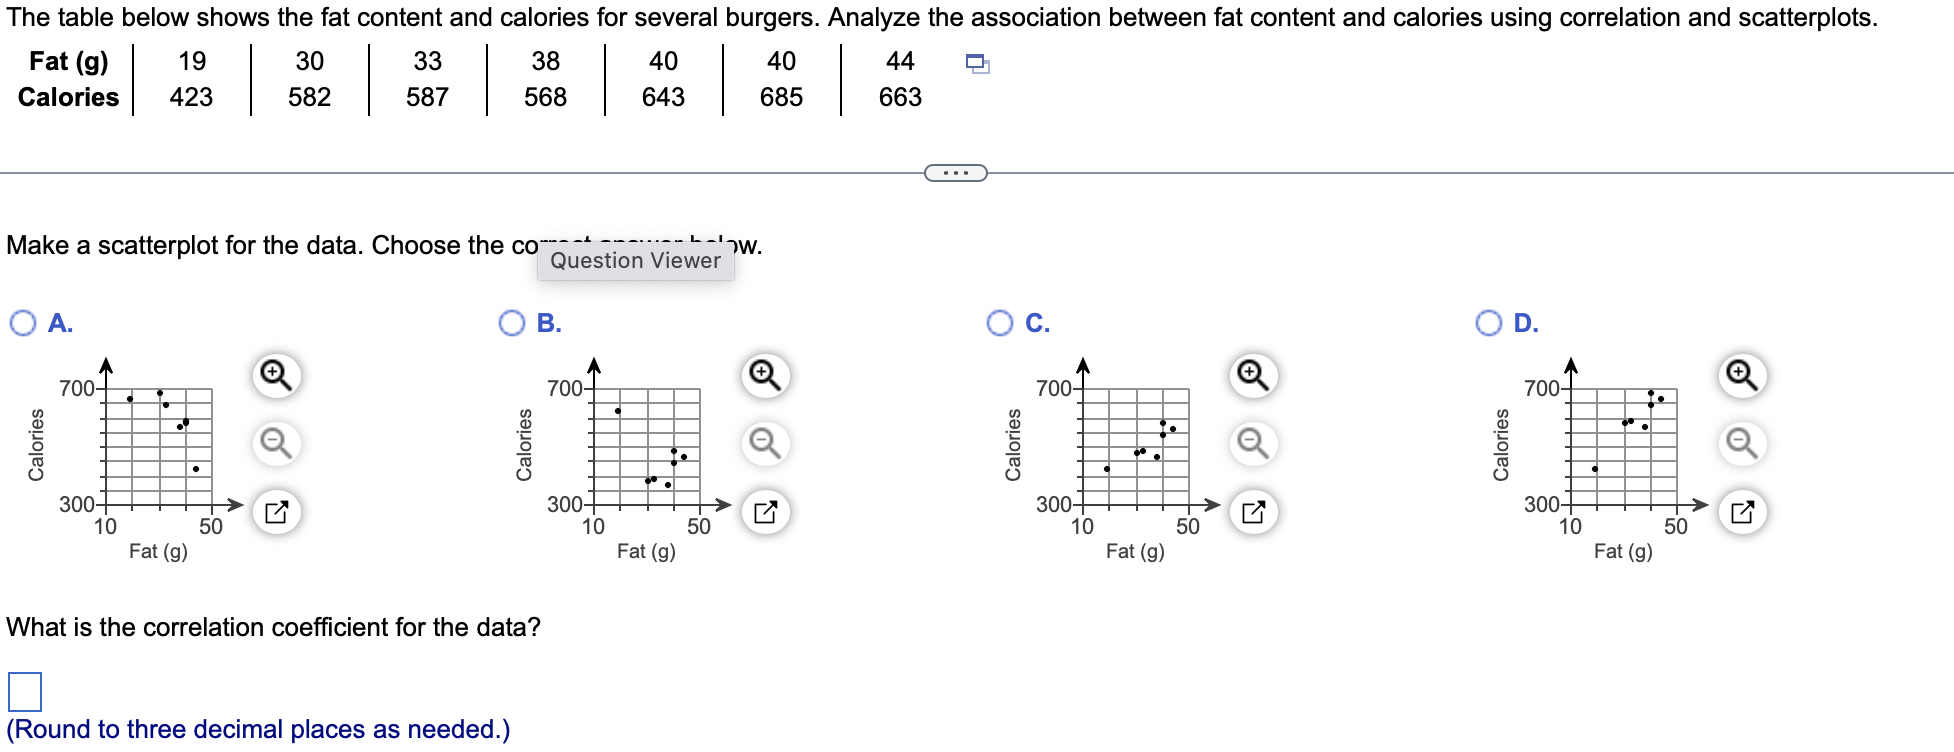
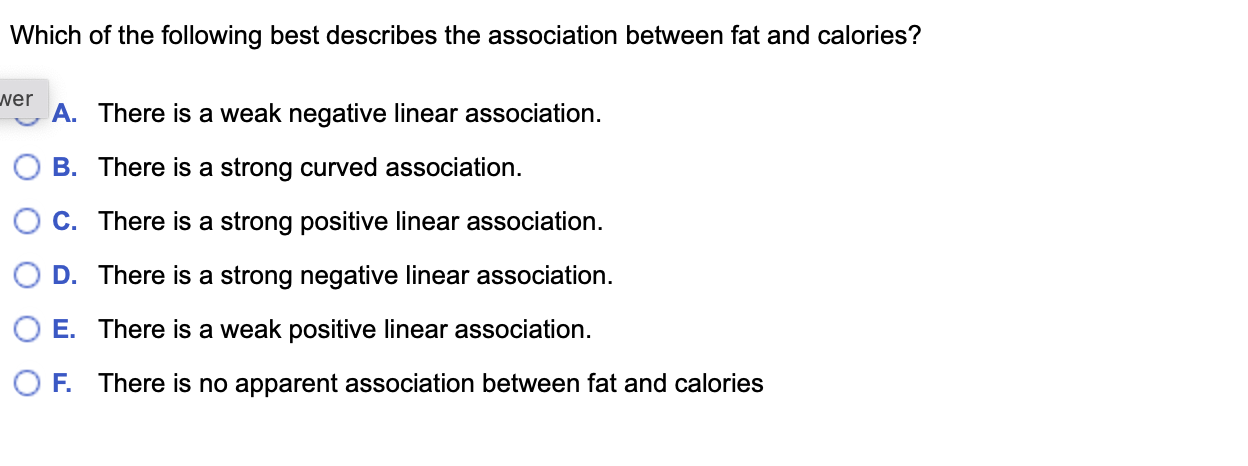
The table below shows the fat content and calories for several burgers. Analyze the association between fat content and calories using correlation and scatterplots. Fat
Step by Step Solution
There are 3 Steps involved in it
Step: 1

Get Instant Access to Expert-Tailored Solutions
See step-by-step solutions with expert insights and AI powered tools for academic success
Step: 2

Step: 3
Ace Your Homework with AI
Get the answers you need in no time with our AI-driven, step-by-step assistance
Get Started
Probability and Stochastic Processes A Friendly Introduction for Electrical and Computer Engineers
Authors: Roy D. Yates, David J. Goodman
3rd edition
1118324560, 978-1118324561