Answered step by step
Verified Expert Solution
Link Copied!

Question

1 Approved Answer

The table below shows the heights of all the students in Grade 12 at West End High School. Height (cm) Frequency 120-130 1 130-140 2
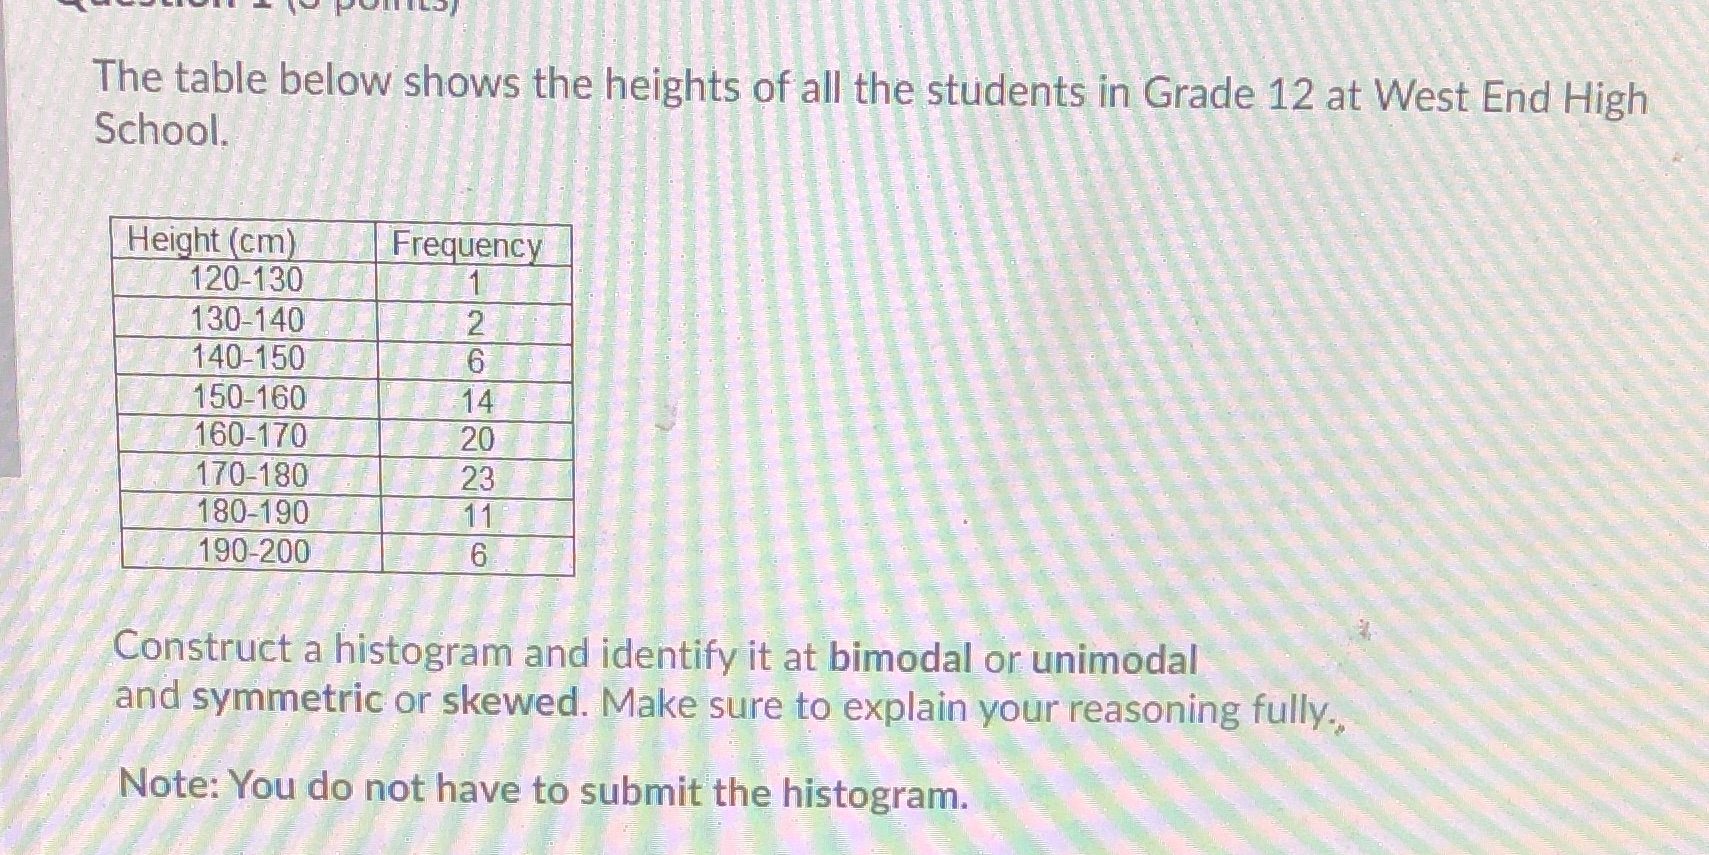
image text in transcribed
The table below shows the heights of all the students in Grade 12 at West End High School. Height (cm) Frequency 120-130 1 130-140 2 140-150 6 150-160 14 160-170 20 170-180 23 180-190 11 190-200 6 Construct a histogram and identify it at bimodal or unimodal and symmetric or skewed. Make sure to explain your reasoning fully., Note: You do not have to submit the histogram

Step by Step Solution

There are 3 Steps involved in it

Step: 1

blur-text-image

Get Instant Access to Expert-Tailored Solutions

See step-by-step solutions with expert insights and AI powered tools for academic success

Step: 2

blur-text-image

Step: 3

blur-text-image

Ace Your Homework with AI

Get the answers you need in no time with our AI-driven, step-by-step assistance

Get Started

Recommended Textbook for

Finite Math And Applied Calculus

Authors: Stefan Waner, Steven Costenoble

7th Edition

1337515566, 9781337515566

More Books

Students also viewed these Mathematics questions

Question

The paleolithic age human life, short write up ?

Answered: 1 week ago