Answered step by step
Verified Expert Solution
Question
1 Approved Answer
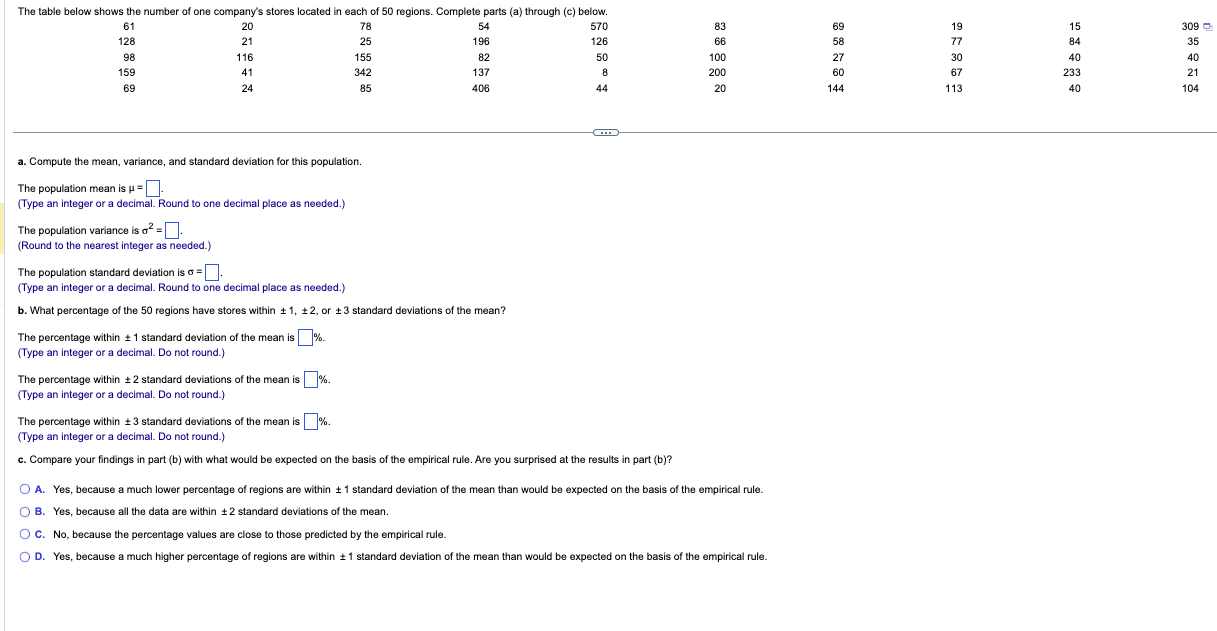
The table below shows the number of one company's stores located in each of 50 regions. Complete parts (a) through (c) below. 61 128 98
 The table below shows the number of one company's stores located in each of 50 regions. Complete parts (a) through (c) below. 61 128 98 159 69 20 21 116 41 24 78 25 155 342 85 54 196 82 137 406 83 66 100 200 20 69 58 27 60 44 19 77 30 67 144 15 84 113 309 35 40 233 21 104 a. Compute the mean, variance, and standard deviation for this population. The population mean is = (Type an integer or a decimal. Round to one decimal place as needed.) The population variance is 2= (Round to the nearest integer as needed.) The population standard deviation is =. (Type an integer or a decimal. Round to one decimal place as needed.) b. What percentage of the 50 regions have stores within 1,2, or \pm 3 standard deviations of the mean? The percentage within \pm 1 standard deviation of the mean is (Type an integer or a decimal. Do not round.) The percentage within \pm 2 standard deviations of the mean is %. (Type an integer or a decimal. Do not round.) The percentage within \pm 3 standard deviations of the mean is %. (Type an integer or a decimal. Do not round.) c. Compare your findings in part (b) with what would be expected on the basis of the empirical rule. Are you surprised at the results in part (b)? A. Yes, because a much lower percentage of regions are within \pm 1 standard deviation of the mean than would be expected on the basis of the empirical rule. B. Yes, because all the data are within \pm 2 standard deviations of the mean. C. No, because the percentage values are close to those predicted by the empirical rule. D. Yes, because a much higher percentage of regions are within \pm 1 standard deviation of the mean than would be expected on the basis of the empirical rule
 Step by Step Solution
There are 3 Steps involved in it
Step: 1

Get Instant Access to Expert-Tailored Solutions
See step-by-step solutions with expert insights and AI powered tools for academic success
Step: 2

Step: 3

Ace Your Homework with AI
Get the answers you need in no time with our AI-driven, step-by-step assistance
Get Started


