Question
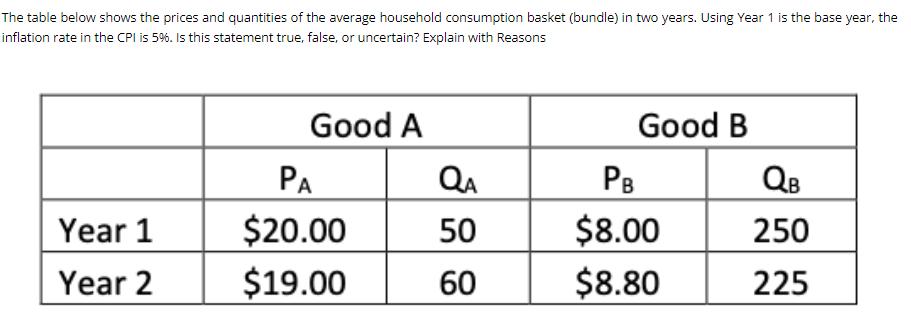
The table below shows the prices and quantities of the average household consumption basket (bundle) in two years. Using Year 1 is the base

The table below shows the prices and quantities of the average household consumption basket (bundle) in two years. Using Year 1 is the base year, the inflation rate in the CPI is 5%. Is this statement true, false, or uncertain? Explain with Reasons Good A Good B PA QA PB QB Year 1 $20.00 50 $8.00 250 Year 2 $19.00 60 $8.80 225
Step by Step Solution
3.45 Rating (152 Votes )
There are 3 Steps involved in it
Step: 1
Step 1 Define CPI Inflation Consumer price index CPI refers to the change in price based on the bask...
Get Instant Access to Expert-Tailored Solutions
See step-by-step solutions with expert insights and AI powered tools for academic success
Step: 2

Step: 3

Ace Your Homework with AI
Get the answers you need in no time with our AI-driven, step-by-step assistance
Get StartedRecommended Textbook for
Macroeconomics
Authors: Olivier J. Blanchard
7th Global Edition
1292160500, 978-1292160504
Students also viewed these Economics questions
Question
Answered: 1 week ago
Question
Answered: 1 week ago
Question
Answered: 1 week ago
Question
Answered: 1 week ago
Question
Answered: 1 week ago
Question
Answered: 1 week ago
Question
Answered: 1 week ago
Question
Answered: 1 week ago
Question
Answered: 1 week ago
Question
Answered: 1 week ago
Question
Answered: 1 week ago
Question
Answered: 1 week ago
Question
Answered: 1 week ago
Question
Answered: 1 week ago
Question
Answered: 1 week ago
Question
Answered: 1 week ago
Question
Answered: 1 week ago
Question
Answered: 1 week ago
Question
Answered: 1 week ago
Question
Answered: 1 week ago
Question
Answered: 1 week ago
View Answer in SolutionInn App


