

Answered step by step
Verified Expert Solution
Question
1 Approved Answer
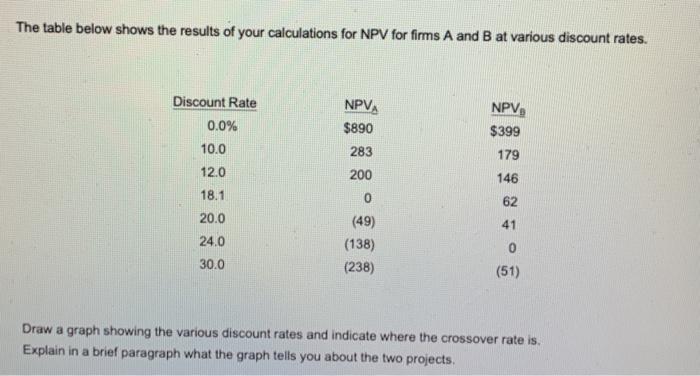
The table below shows the results of your calculations for NPV for firms A and B at various discount rates. Discount Rate 0.0% 10.0 12.0
Step by Step Solution
There are 3 Steps involved in it
Step: 1

Get Instant Access to Expert-Tailored Solutions
See step-by-step solutions with expert insights and AI powered tools for academic success
Step: 2

Step: 3
Ace Your Homework with AI
Get the answers you need in no time with our AI-driven, step-by-step assistance
Get Started
Ichimoku Charting And Technical Analysis
Authors: Charles G Koonitz
1st Edition
1989118739, 978-1989118733