

Question
The table below shows your stock positions at the beginning of the year, the dividends that each stock paid during the year, and the stock
The table below shows your stock positions at the beginning of the year, the dividends that each stock paid during the year, and the stock prices at the end of the year.
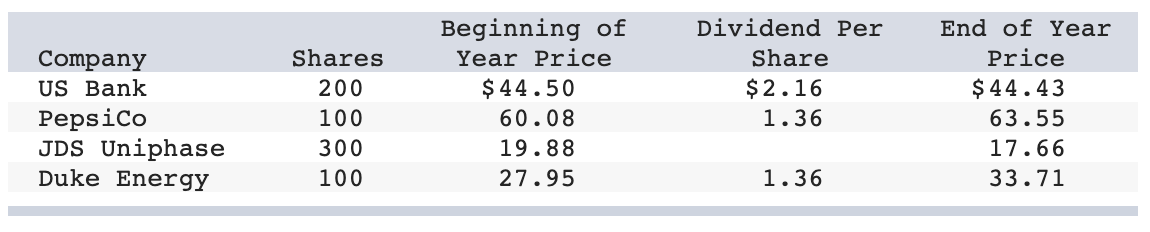
What is your portfolio dollar return and percentage return? (Round your answers to 2 decimal places.)
Step by Step Solution
There are 3 Steps involved in it
Step: 1

Get Instant Access to Expert-Tailored Solutions
See step-by-step solutions with expert insights and AI powered tools for academic success
Step: 2

Step: 3
Ace Your Homework with AI
Get the answers you need in no time with our AI-driven, step-by-step assistance
Get Started
Multinational financial management
Authors: Alan c. Shapiro
10th edition
9781118801161, 1118572386, 1118801164, 978-1118572382