Answered step by step
Verified Expert Solution
Question
1 Approved Answer
The table below, taken from a paper by Bickart and Schmittlein (1999), shows the number of surveys filled out by a sample of 1865 Americans
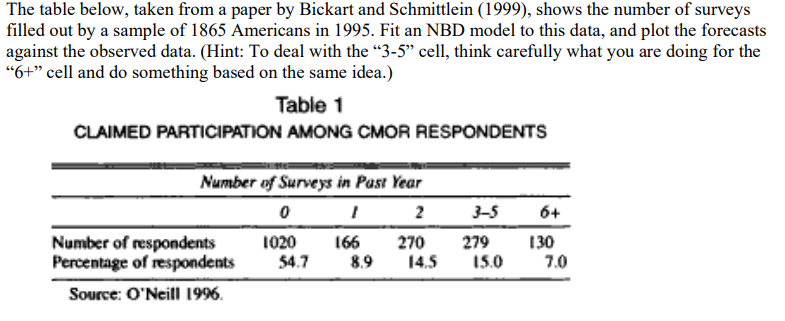
The table below, taken from a paper by Bickart and Schmittlein (1999), shows the number of surveys filled out by a sample of 1865 Americans in 1995. Fit an NBD model to this data, and plot the forecasts against the observed data. (Hint: To deal with the 3-5" cell, think carefully what you are doing for the "6+" cell and do something based on the same idea.) Table 1 CLAIMED PARTICIPATION AMONG CMOR RESPONDENTS Number of Surveys in Pust Year 0 1 2 Number of respondents 1020 166 270 Percentage of respondents 54.7 8.9 14.5 Source: O'Neill 1996 3-5 279 15.0 6+ 130 7.0 The table below, taken from a paper by Bickart and Schmittlein (1999), shows the number of surveys filled out by a sample of 1865 Americans in 1995. Fit an NBD model to this data, and plot the forecasts against the observed data. (Hint: To deal with the 3-5" cell, think carefully what you are doing for the "6+" cell and do something based on the same idea.) Table 1 CLAIMED PARTICIPATION AMONG CMOR RESPONDENTS Number of Surveys in Pust Year 0 1 2 Number of respondents 1020 166 270 Percentage of respondents 54.7 8.9 14.5 Source: O'Neill 1996 3-5 279 15.0 6+ 130 7.0
Step by Step Solution
There are 3 Steps involved in it
Step: 1
Get Instant Access to Expert-Tailored Solutions
See step-by-step solutions with expert insights and AI powered tools for academic success
Step: 2
Step: 3
Ace Your Homework with AI
Get the answers you need in no time with our AI-driven, step-by-step assistance
Get Started